

A map of New York City in 1900 shows a very different city from the one of a century before: only two years earlier, on 1 January 1898, Manhattan, Brooklyn, the Bronx, Queens and Staten Island had been joined into one Greater New York, and the 1811 street grid had spread almost to the northern tip of Manhattan. This article follows New York’s maps from the Dutch town of the 1660s to the satellite views of today. It is for students and readers interested in urban history, and it adds a short guide to the planning principles each map reveals, from a walled port to a gridded metropolis.
The skyline of New York City has changed dramatically in the last 200 years, but its maps tell an even longer story: how a trading post on the tip of an island became one of the world’s largest cities.
The map of New York City through the years
The 1660s: New Amsterdam and the Castello Plan
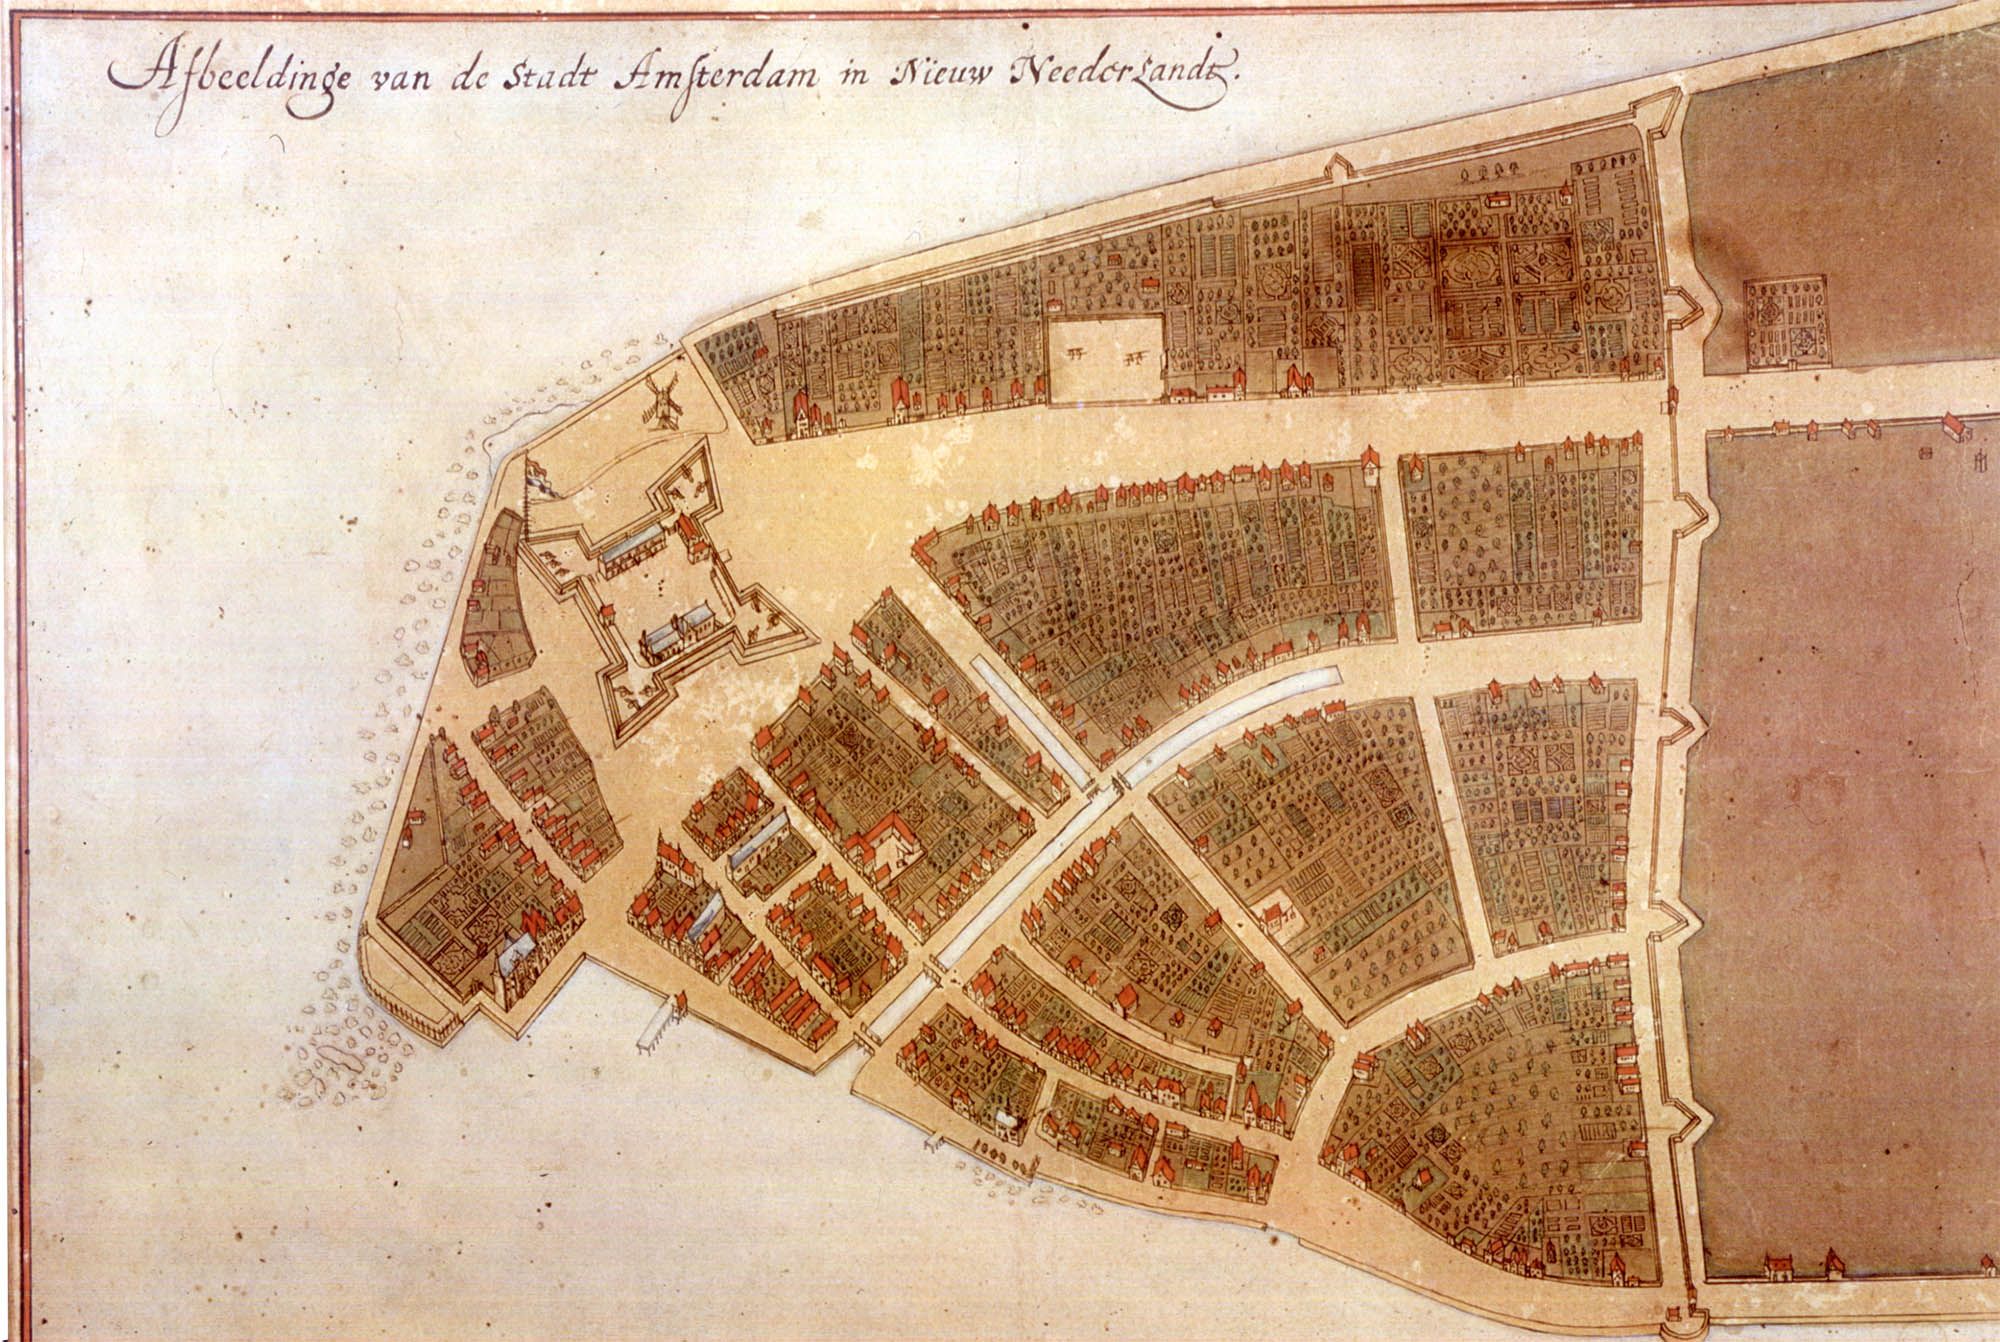
Castello Map,1660-Courtesy of NYC99.org
The Castello Plan is one of the oldest maps of what is now New York City. It shows New Amsterdam in 1660, drawn by the colony’s surveyor Jacques Cortelyou; the surviving copy, made between about 1665 and 1670, was found at the Villa di Castello near Florence, which gave it its name, according to accounts of Cortelyou’s work. It shows a small, dense town of about 300 houses, gardens and a fort at the southern tip of Manhattan, bounded on the north by a defensive wall along the line of today’s Wall Street. In 1664 the English took the colony and renamed it New York.
The 1760s: the Ratzer map
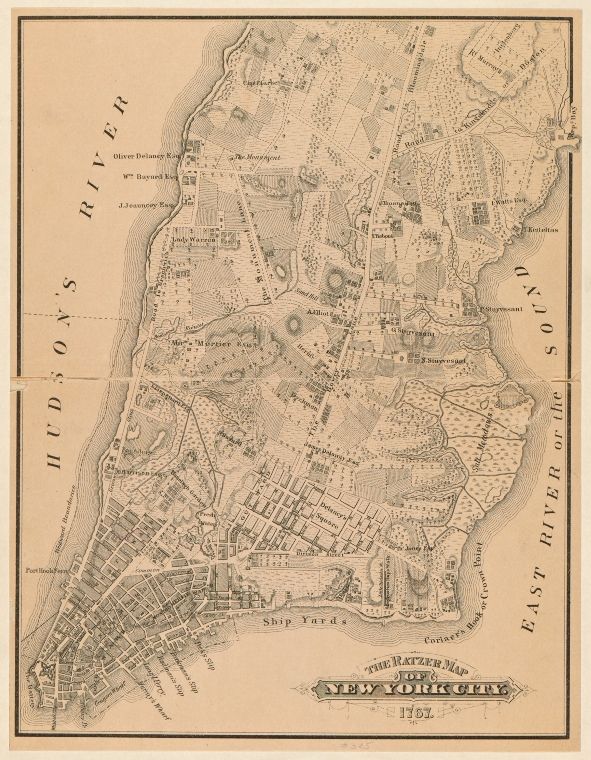
Ratzer Map,1770-Courtesy of New York Public Library
The British military surveyor Bernard Ratzer mapped New York and its surroundings in 1766-67, before the American Revolution. His plan shows the city growing north from the southern tip, with streets laid out piecemeal by individual landowners and farms, estates and marshes still covering most of the island.
1811: the Commissioners’ Plan and the grid
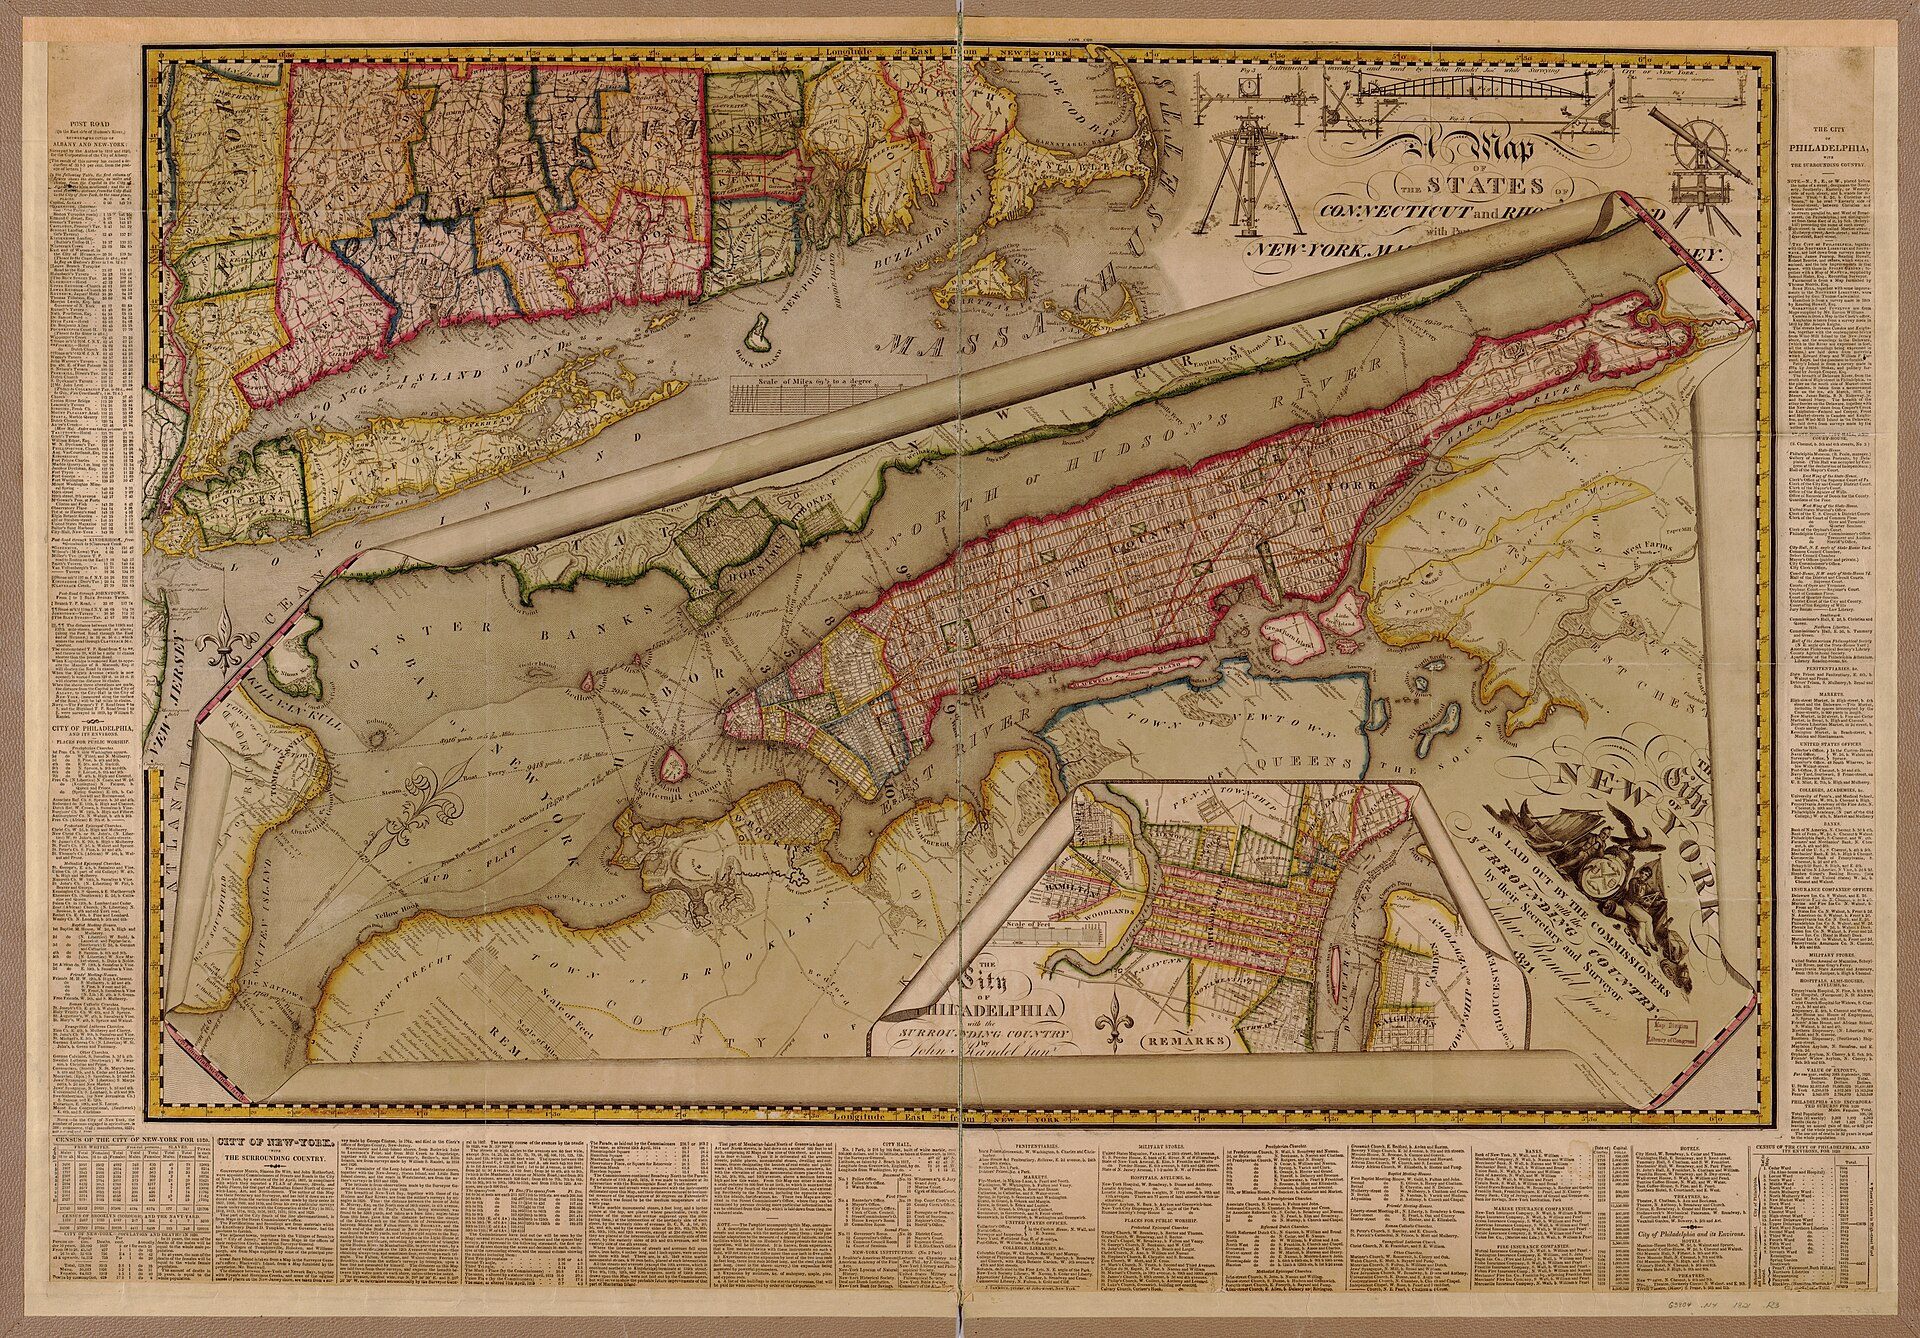
The Commissioners' Plan for Manhattan, surveyed by John Randel Jr. (1811; this engraving published 1821). Public domain, via Wikimedia Commons. Image: John Randel. Engraved by P. Maverik. (Public domain (verified))
The Commissioners’ Plan of 1811 laid a rectangular grid of 12 north-south avenues and 155 cross streets over Manhattan north of the existing city, regardless of hills, streams and property lines. The map was published by William Bridges, although the survey was carried out by John Randel Jr., as map historians note. The grid became the framework for almost everything built in Manhattan afterwards; Central Park, added in the 1850s, was one of the few large interruptions.
The 1850s: two separate cities
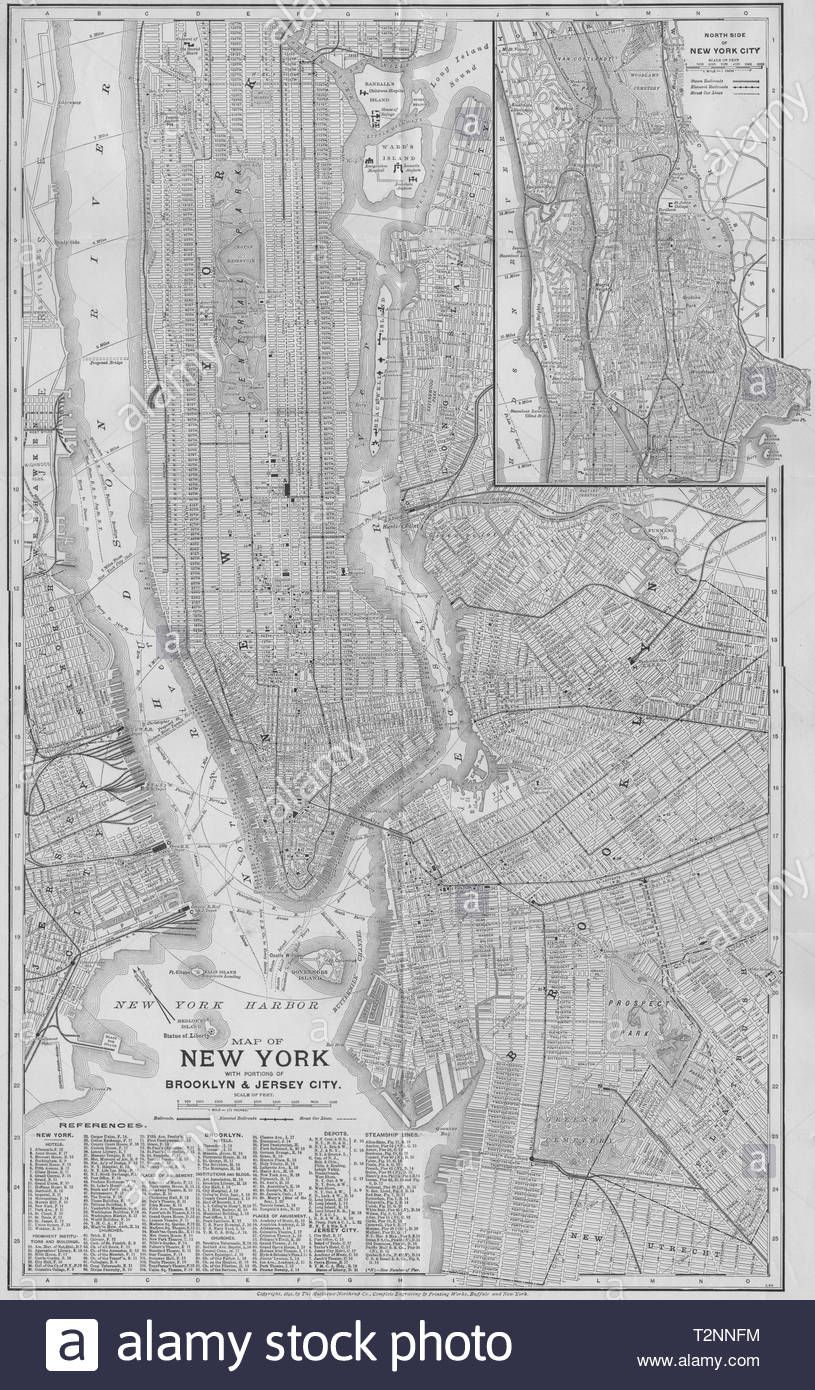
New York in 1851-Courtesy of Simpson
An 1851 map shows Brooklyn and Manhattan as two separate cities with no fixed connection: commuters crossed the East River by ferry. The grid had reached only the middle of the island. The Brooklyn Bridge, opened in 1883, was the first fixed crossing, and it changed the relationship between the two cities for good.
The map of New York City in 1900
By 1900 the map had changed in scale. The consolidation of 1 January 1898 created a city of five boroughs, as the City of New York’s archaeology timeline records, with about 3.4 million people at the 1900 census. A map of New York City in 1900 therefore shows a single city spread across islands and the mainland, with Manhattan’s grid largely built up, Brooklyn and Queens filling with new streets, and new bridges and the first subway line (opened in 1904) about to tie the boroughs together.
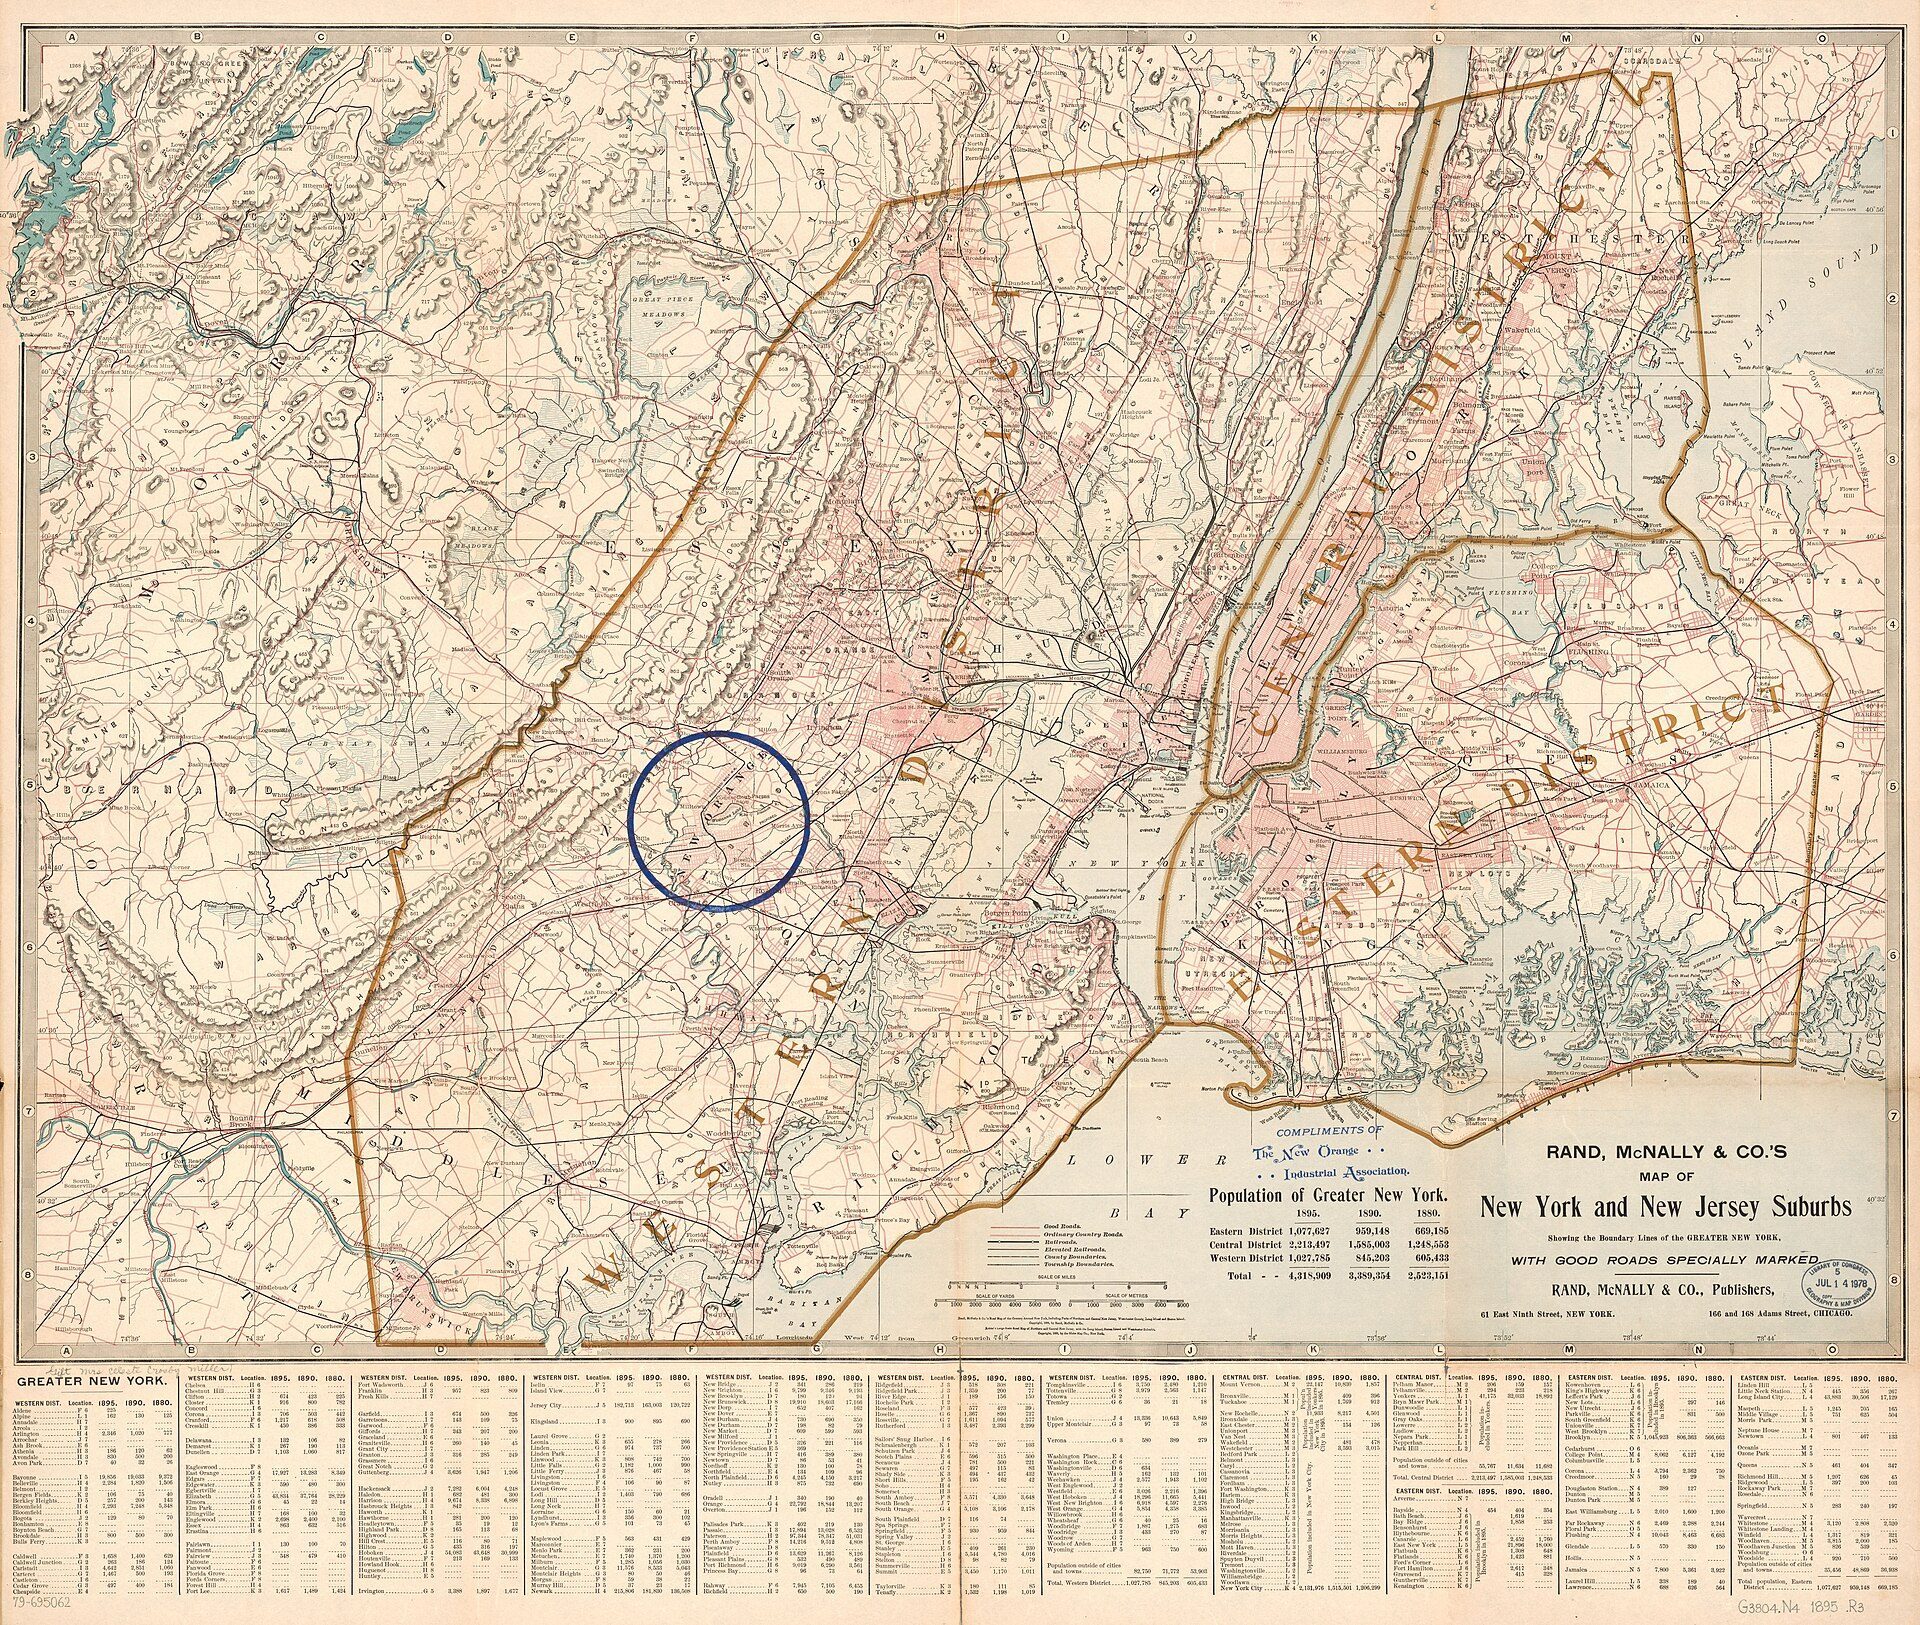
Rand McNally map of New York and the New Jersey suburbs showing the boundary lines of Greater New York, around the time of consolidation (Library of Congress). Public domain, via Wikimedia Commons. Image: Rand Mcnally And Company; Crosby, Oscar Terry (Public domain (verified))
The bridges built in the following years made consolidation physical. The photograph below shows the Manhattan Bridge under construction over the East River in the first decade of the 20th century, next to the older Brooklyn Bridge’s route.
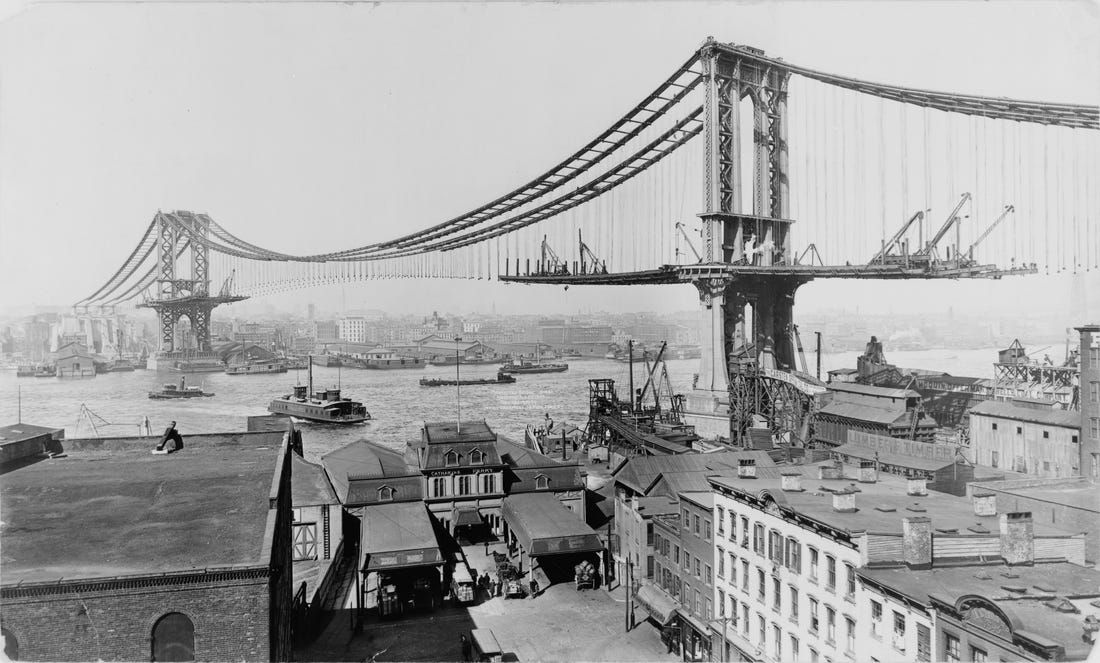
New York in 1880s-Courtesy of John Bachmann
The 1960s: Hermann Bollmann’s picture map
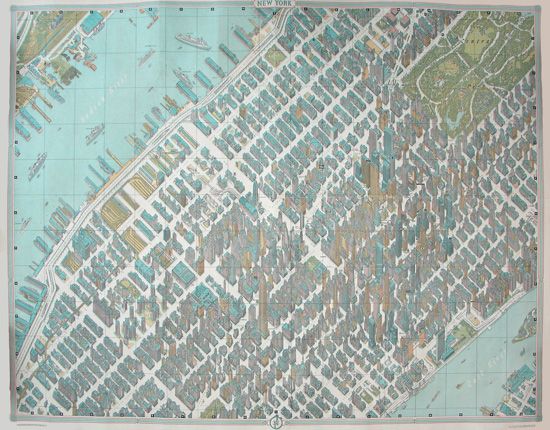
View by Herman Bollmann in 1960s-Courtesy of David Rumsey
Hermann Bollmann’s bird’s-eye view of Manhattan from the early 1960s draws every building in three dimensions, showing how skyscrapers now dominated Midtown and Lower Manhattan, and how the 1811 grid shaped the long, narrow blocks between them.
The 1980s: Constantine Anderson’s isometric map
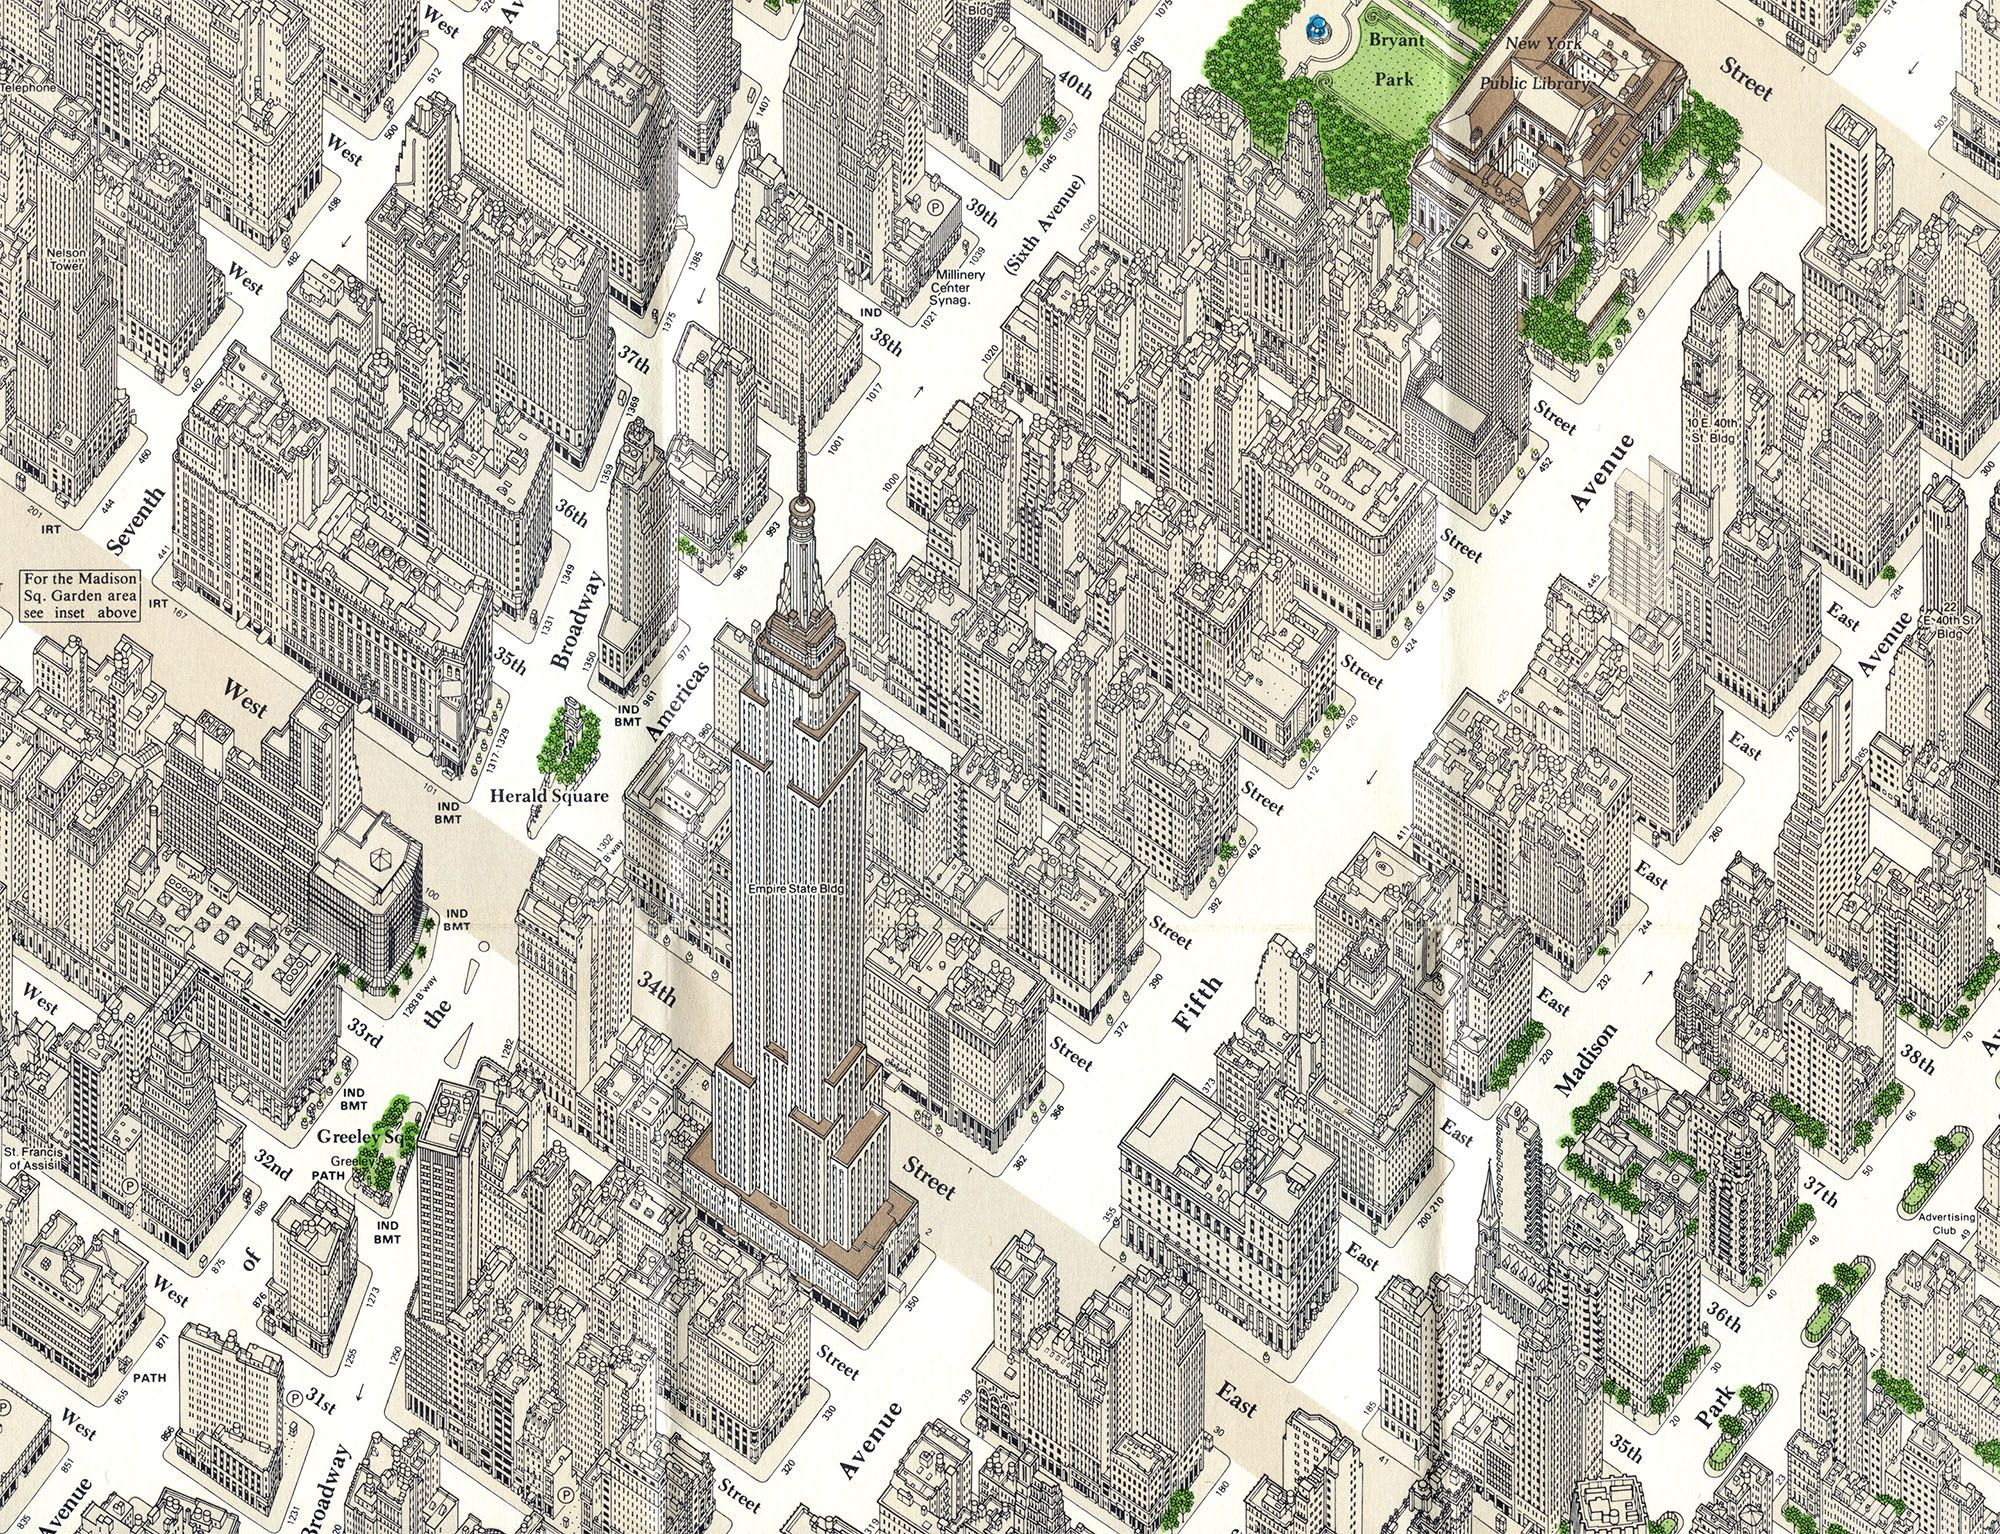
Constantine Anderson’s isometric map of Midtown Manhattan, begun in 1961 and updated by Anderson until 1981 and then by other architects until its 1985 edition, draws each building with its windows, canopies, trees and even telephone booths, according to the David Rumsey Map Collection.
The 2010s: aerial views
In 2013 the AirPano project published aerial panoramas of Manhattan, including the view below of Central Park surrounded by dense blocks: a reminder that the park is itself a large rectangle cut from the 1811 grid.
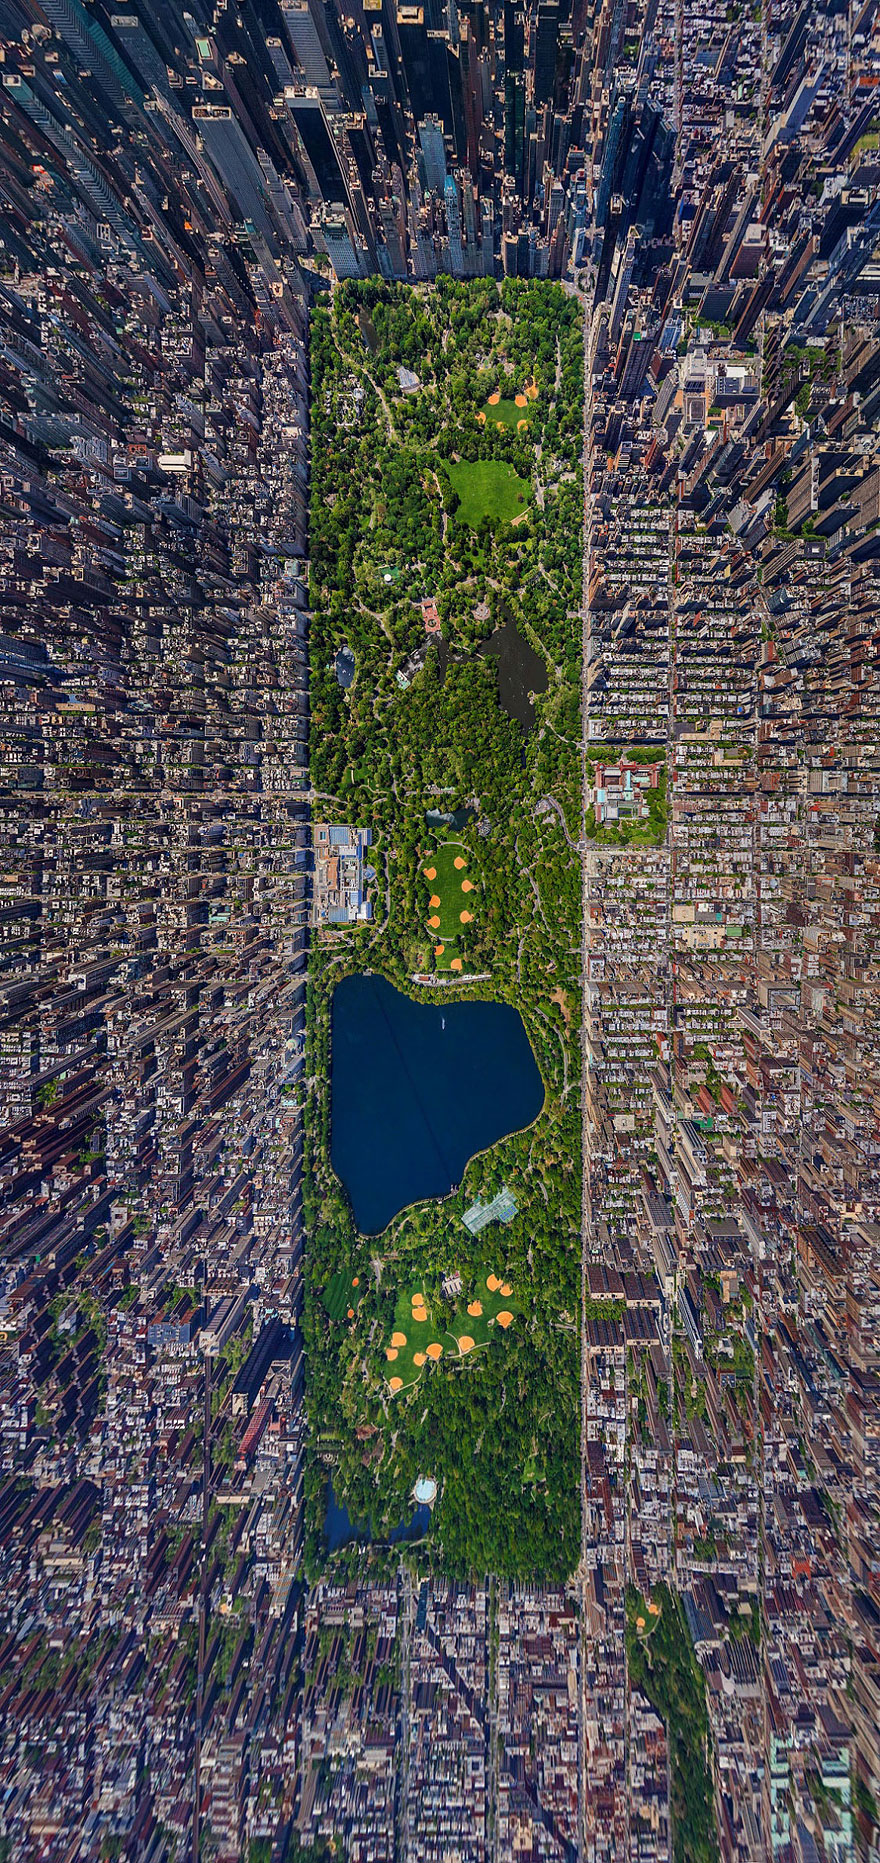
AirPano.com, dailymail, geekologie
Planning principles the maps reveal
Read together, the maps show several principles that students can use when analysing any city:
- Topography first, then geometry. The Dutch town followed the shoreline and paths; the 1811 grid ignored topography in favour of easily sold, regular lots.
- The grid as a real-estate tool. Uniform blocks made land easy to divide, value and sell, which is why the plan was so durable.
- Infrastructure redraws the map. Bridges, the subway and later highways changed which areas could grow; the 1883 and 1909 bridges turned two cities into one.
- Open space must be reserved deliberately. The 1811 plan included few parks; Central Park had to be inserted later.
- Political boundaries shape planning. Consolidation in 1898 made it possible to plan bridges, water and transit across the five boroughs as one system.
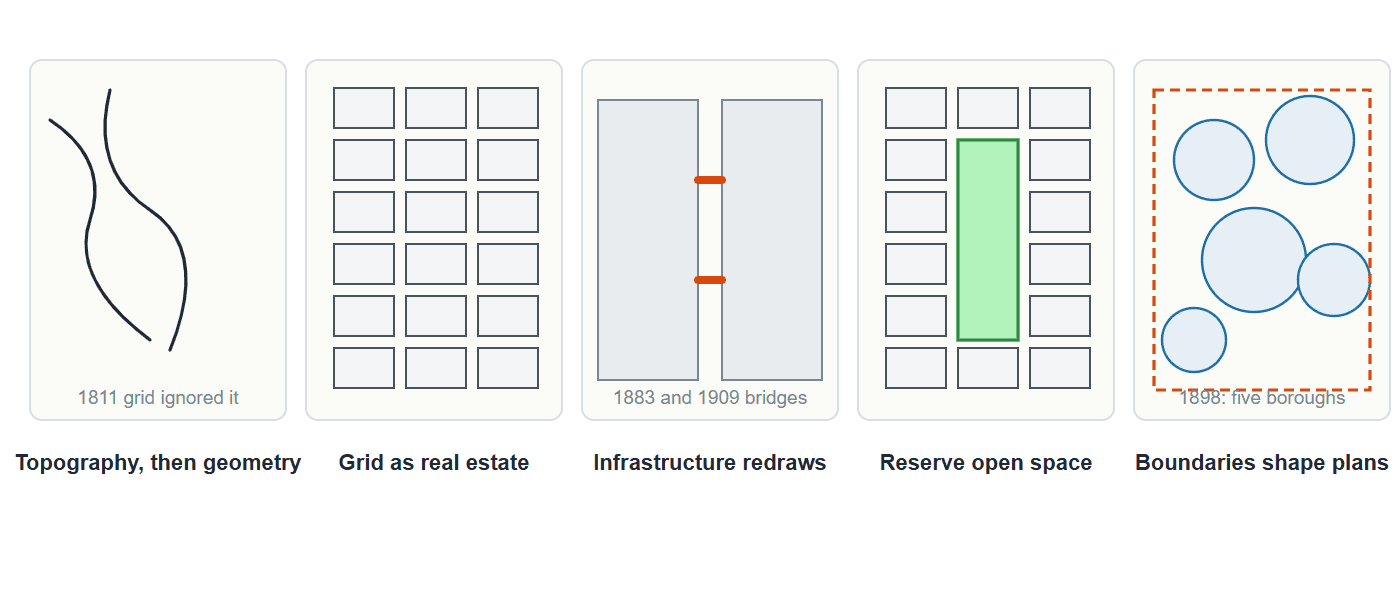
Five planning principles from New York's maps: topography first, then geometry (the Dutch town followed shore and paths; the 1811 grid ignored them), the grid as a real-estate tool, infrastructure redrawing the map (the 1883 and 1909 bridges), open space reserved deliberately (Central Park inserted later), and political boundaries (consolidation in 1898). Diagram: Arch2O
Precedent analysis: the grid and its alternatives
Manhattan’s grid is often compared with other planned cities. Barcelona’s Eixample (Ildefons Cerdà, 1859) uses square blocks with chamfered corners to improve light and traffic; Washington, DC (Pierre L’Enfant, 1791) overlays diagonal avenues on a grid to connect monuments. Manhattan’s grid is the most purely commercial of the three: long rectangular blocks, few diagonals (Broadway is the major survivor of the earlier street pattern) and no built-in public squares. Projects such as the High Line show how today’s designers find new public space inside that rigid framework.
Sources and further reading
- NYC archaeology timeline: consolidation of the five-borough city.
- Barry Lawrence Ruderman Antique Maps: William Bridges and the 1811 plan.
- David Rumsey Map Collection: Anderson’s Midtown map.
New York’s maps show how planning decisions, from a Dutch wall to a commissioners’ grid and a political merger, still shape the city a reader walks through today. For more on the city, see Arch2O’s coverage of New York.
By: Vaibhav Sharma

Vaibhav Sharma is an editor at Arch2O with a background in architecture and urban design. He holds a Master’s degree in Urban Design from the University of Management & Technology. With experience as an architect at Master Consulting Engineers (Pvt.) Ltd. in Pakistan, Vaibhav brings a strong foundation in architectural and urban planning principles to his editorial work. His contributions to Arch2O reflect a commitment to exploring and communicating innovative design ideas and practices.