

Operational carbon is the greenhouse gas emitted by running a building: heating, cooling, hot water, ventilation, lighting, lifts and plugged-in equipment, mostly through the energy it buys. Designers influence most of it before anyone moves in, through form and orientation, the fabric (insulation, airtightness, windows), the choice of heating and cooling system, and how easy the building is to run well. This guide explains where operational carbon comes from, which design decisions matter most in different climates and building types, works through a simple calculation, and lists the common misconceptions.
Quick answer: where operational carbon sits
In the life-cycle framework used in Europe and the UK (EN 15978), operational energy and water are modules B6 and B7, separate from the embodied carbon of materials. The World Green Building Council’s 2019 report Bringing Embodied Carbon Upfront put building operations at about 28% of global energy-related carbon emissions, against about 11% for materials and construction. For most existing buildings, operational carbon is still the larger share over their lifetime; for new, efficient buildings on a cleaner grid, the balance shifts towards embodied carbon.

Passive House Institute certification plaque ('Bâtiment Passif', Premium class) at the Maison Avenidor. Photo: Aielaine, CC BY-SA 4.0, via Wikimedia Commons. Aielaine, source, CC BY-SA 4.0
How it works: the three things designers control
Operational carbon is the product of two numbers: how much energy the building uses, and how much carbon each unit of that energy carries.
- Demand: the energy the building needs, set by form, orientation, insulation, airtightness, glazing, shading and ventilation strategy. Reducing demand is the most durable measure because it does not depend on future fuel or grid changes.
- Efficiency: how well systems turn energy into heat, cooling, light and air. A heat pump typically delivers several units of heat for each unit of electricity; a gas boiler delivers less than one.
- Supply: the carbon intensity of the energy, which depends on the fuel and the electricity grid, plus any on-site renewables such as solar panels.
A fourth factor, operation, is shared with the people who run the building. CIBSE’s TM54: Evaluating operational energy use at the design stage (2022 edition) attributes the “performance gap” between predicted and measured energy partly to unrealistic modelling assumptions and partly to construction quality, commissioning and how occupants use controls. Designers can narrow that gap by modelling realistic hours and loads, specifying simple controls and planning for testing and handover.
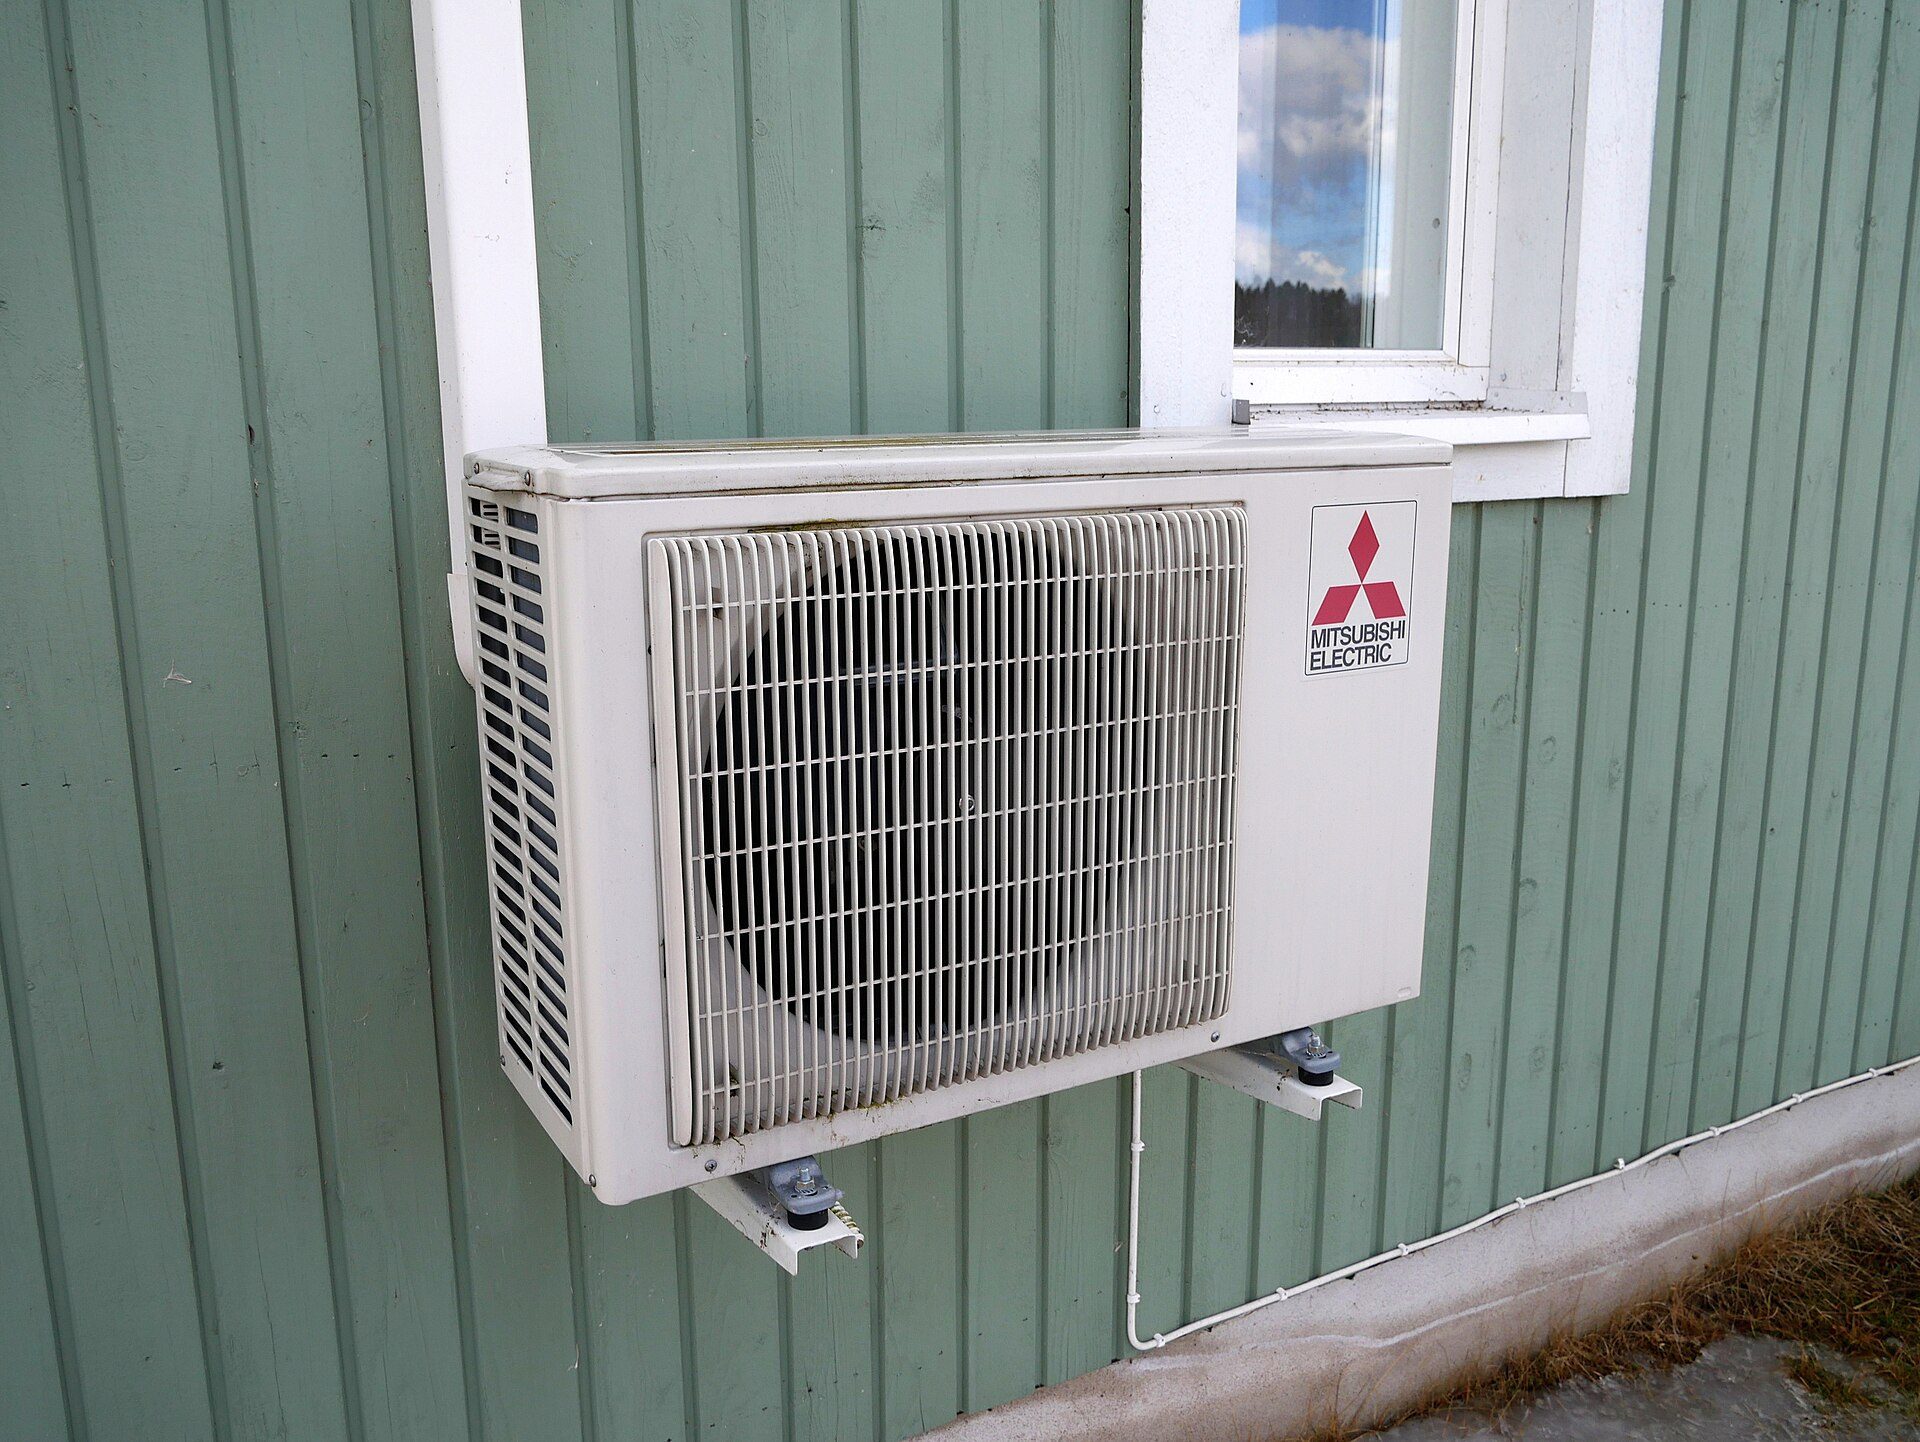
Outdoor unit of an air source heat pump. Photo: Santeri Viinamäki, CC BY-SA 4.0, via Wikimedia Commons. Santeri Viinamäki, source, CC BY-SA 4.0
Applicability: what matters most where
| Context | Biggest operational loads | Design levers with most influence |
|---|---|---|
| Cold and temperate climates, homes | Space heating, hot water | Insulation, airtightness with heat-recovery ventilation, compact form, heat pumps |
| Hot climates, homes | Cooling, dehumidification | Shading, roof insulation, reflective roofs, cross-ventilation where humidity allows, efficient air conditioning |
| Offices and schools (any climate) | Lighting, ventilation, cooling, equipment | Daylight with glare control, efficient lighting and controls, demand-controlled ventilation, limiting solar gain |
| Hospitals, labs, data-heavy buildings | Ventilation, process loads, 24-hour operation | Heat recovery, efficient plant, zoning, realistic load forecasting |
| Refurbishment of existing buildings | Space heating (often dominant) | Fabric upgrades in sequence, then system replacement; protect heritage fabric and manage moisture |
Source: Arch2O summary of general design practice; Passive House criteria; CIBSE TM54 (2022) (as of 2026-11-01).
The table is Arch2O’s summary of general design practice; it is not a ranking from a single study. In every case, check the energy model against the local climate file and the local energy mix.
Worked example: demand, efficiency and supply
This illustrative calculation, written for this guide, uses the UK SAP 10.1 carbon factors (grid electricity 0.136 kgCO2e/kWh; mains gas 0.210 kgCO2e/kWh, published October 2019). Other countries and later versions use different factors, and the grid factor falls as electricity decarbonises. Efficiency figures are assumptions.
Take an 80 m² home and compare three cases for space heating only:
- Typical fabric, gas boiler: assume 100 kWh/m² per year of heat demand = 8,000 kWh. With a 90% efficient boiler, gas use is 8,000 ÷ 0.9 = 8,889 kWh. Carbon: 8,889 × 0.210 = about 1,867 kgCO2e per year.
- Typical fabric, heat pump: same 8,000 kWh of heat, heat pump with an assumed seasonal efficiency of 3.0. Electricity: 8,000 ÷ 3 = 2,667 kWh. Carbon: 2,667 × 0.136 = about 363 kgCO2e per year.
- Passive House-level fabric, heat pump: the Passive House standard limits space heating demand to 15 kWh/m² per year (with airtightness of 0.6 air changes per hour at 50 Pa). Heat: 15 × 80 = 1,200 kWh. Electricity: 1,200 ÷ 3 = 400 kWh. Carbon: 400 × 0.136 = about 54 kgCO2e per year.
Switching fuel cuts the illustrative figure by about 80%; cutting demand as well takes it down by about 97% compared with the first case. The exact numbers depend on the assumptions, but the order of decisions holds: reduce demand, then supply what is left efficiently from the lowest-carbon source.
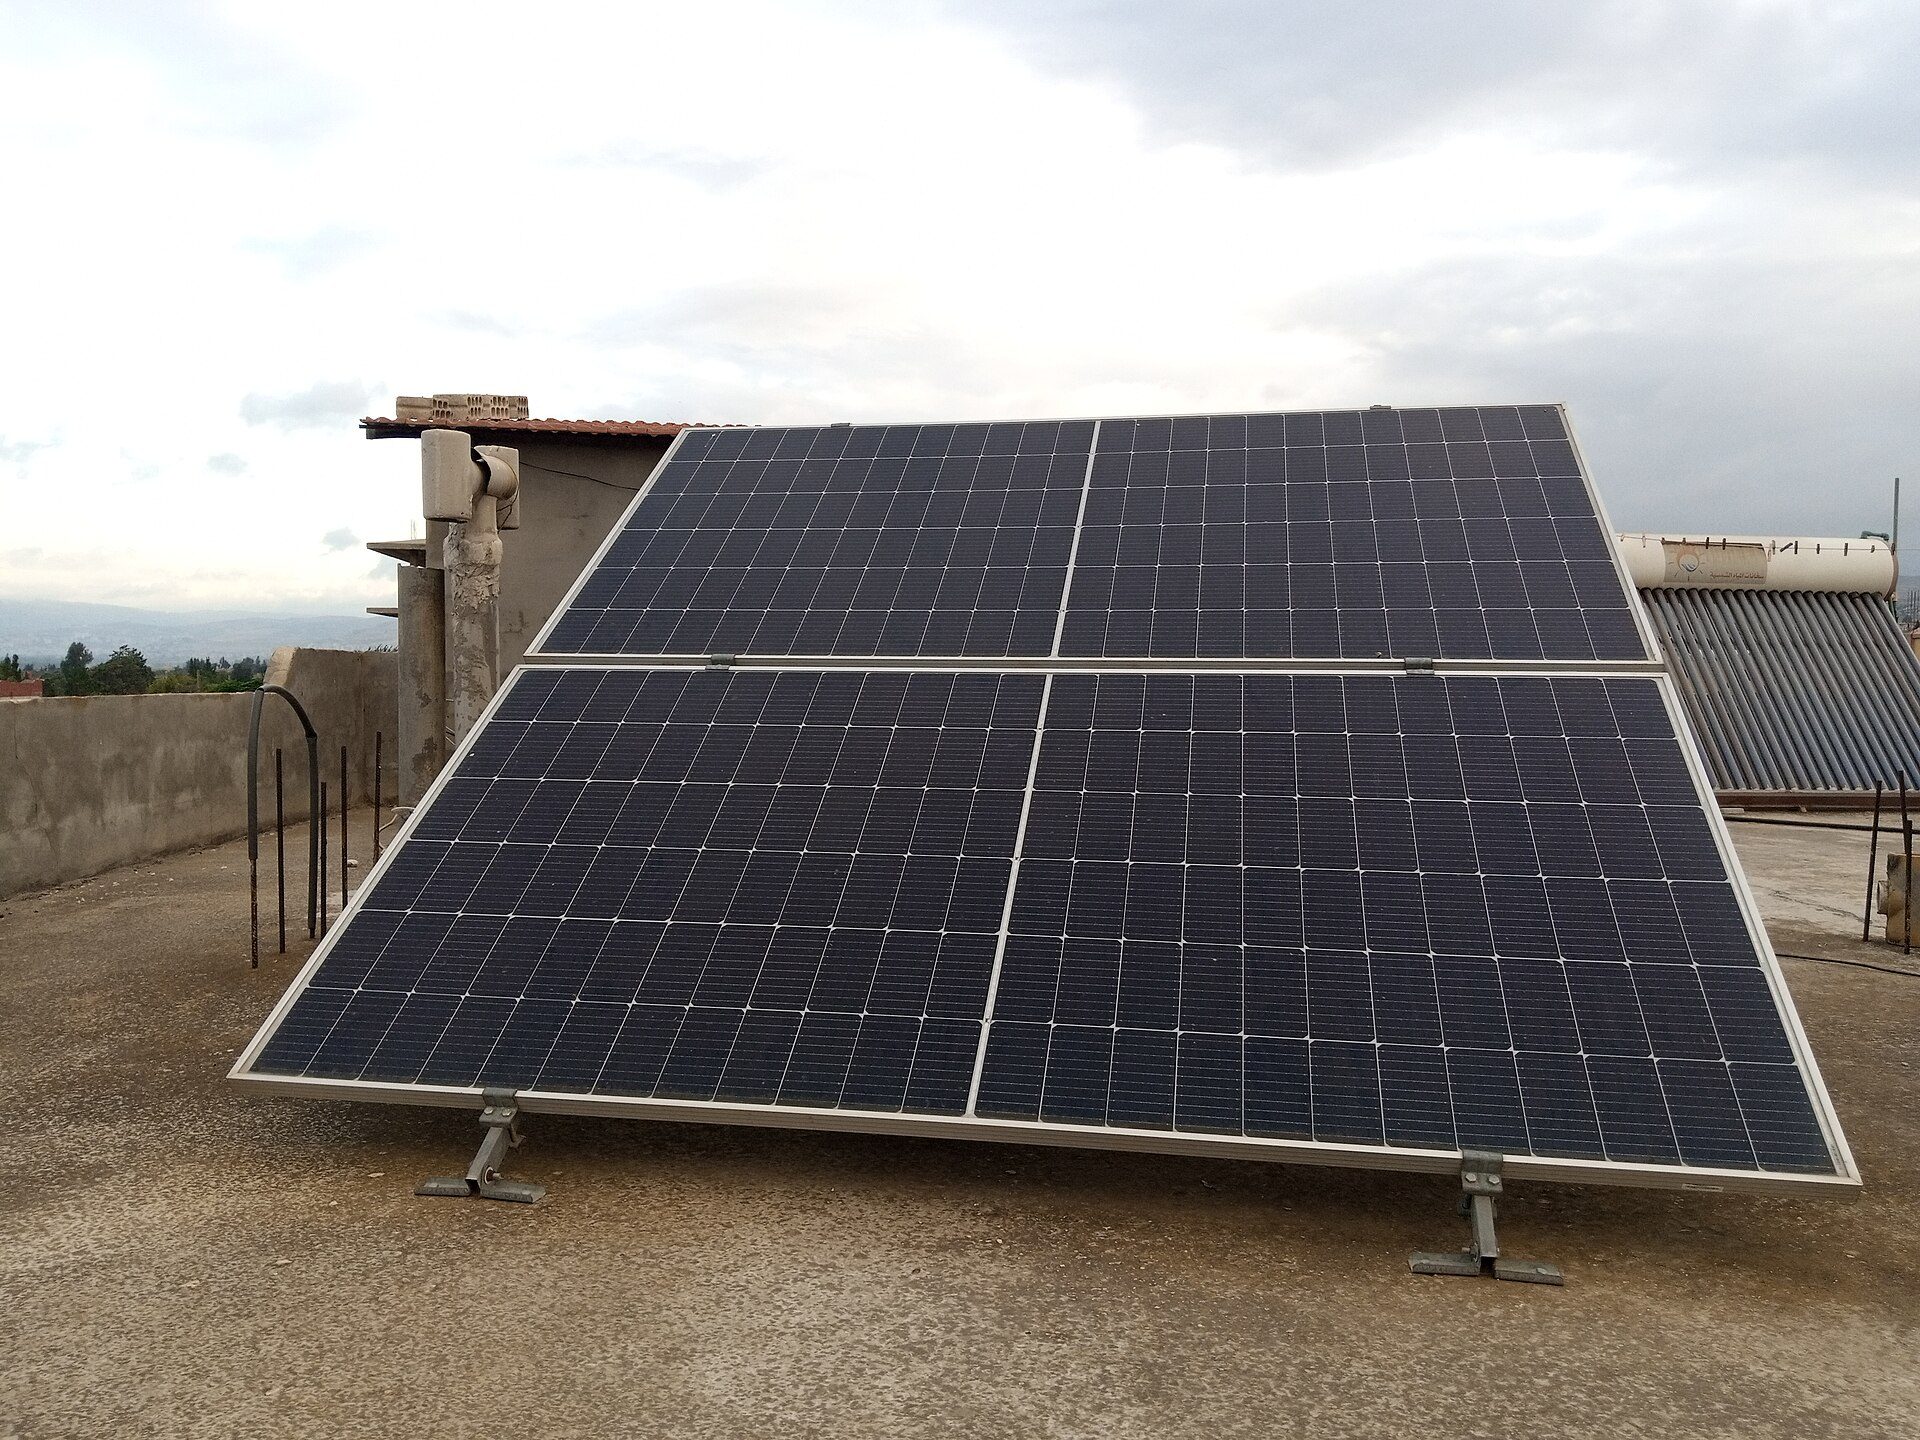
A small rooftop photovoltaic array in rural Homs, Syria. Photo: Hayan Alhasan, CC BY-SA 4.0, via Wikimedia Commons. Hayan Alhasan, source, CC BY-SA 4.0
Design-stage checklist
- Concept: test orientation, massing and window-to-wall ratio in a simple energy model before the form is fixed; compact forms lose less heat.
- Fabric: set target U-values and an airtightness target, and detail junctions to avoid thermal bridges; agree how airtightness will be tested on site.
- Systems: choose the heating and cooling strategy early, because heat pumps, ventilation with heat recovery and low-temperature emitters affect plant space, risers and ceiling depths.
- Forecast: produce a realistic energy forecast (for example, following CIBSE TM54) as well as the compliance calculation, using expected hours, occupancy and equipment loads.
- Handover: plan commissioning, simple user guides and at least a year of monitoring, so that the building is run the way it was designed.
Limitations and common misconceptions
- “Net zero” labels vary. Check what is included (regulated energy only, or all energy including plug loads) and whether offsets are used.
- Compliance models are not predictions. Regulatory calculations use standard assumptions; use a TM54-style forecast for realistic energy use.
- Glazing is not free daylight. Large unshaded glazing can raise both heating and cooling loads; size and shade it for the climate.
- Renewables do not fix a poor envelope. On-site generation is limited by roof area; demand reduction comes first.
- Grid factors change. A building that looks high-carbon on today’s grid may improve as the grid decarbonises, but only if it runs on electricity.
- Operational and embodied carbon trade off. Extra insulation, triple glazing and batteries carry embodied carbon; look at whole-life carbon, not one side alone.
Decision summary
To influence operational carbon, design the form and fabric to cut demand for the local climate, choose efficient electric systems where the grid is decarbonising, add renewables where the roof allows, and plan for commissioning and realistic forecasts. Digital tools now make early energy modelling easier; Arch2O’s overview of AI tools for architects covers some of them. For the wider picture, see Arch2O’s guide to what is sustainable architecture.

Luca Moretti is a content strategist with a foundation in urban design and architecture. Based in Milan, he focuses on writing that bridges aesthetics, material culture, and everyday spatial experiences.