

Embodied carbon is the greenhouse gas emitted to make, transport, build with, maintain and finally dispose of a building’s materials, as opposed to the operational carbon from heating, cooling and power. To read a material comparison correctly, check four things before you look at the numbers: which life-cycle stages are counted, what unit is being compared (a kilogram of material is not a square metre of floor), where the data comes from, and how timber’s stored carbon is treated. This guide explains each check, works through an illustrative comparison, and lists the common mistakes, for architects, students and clients who are handed carbon figures and need to judge them.
Quick answer: why embodied carbon matters now
In its 2019 report Bringing Embodied Carbon Upfront, the World Green Building Council put building materials and construction at about 11% of global energy-related carbon emissions, within a building-sector total of about 39%. As heating and power decarbonise, the share of a new building’s whole-life emissions that comes from its materials rises, and most of that carbon is emitted before the building opens. That is why planning authorities, clients and rating systems increasingly ask for embodied carbon figures at design stage, and why it matters whether those figures are comparable.
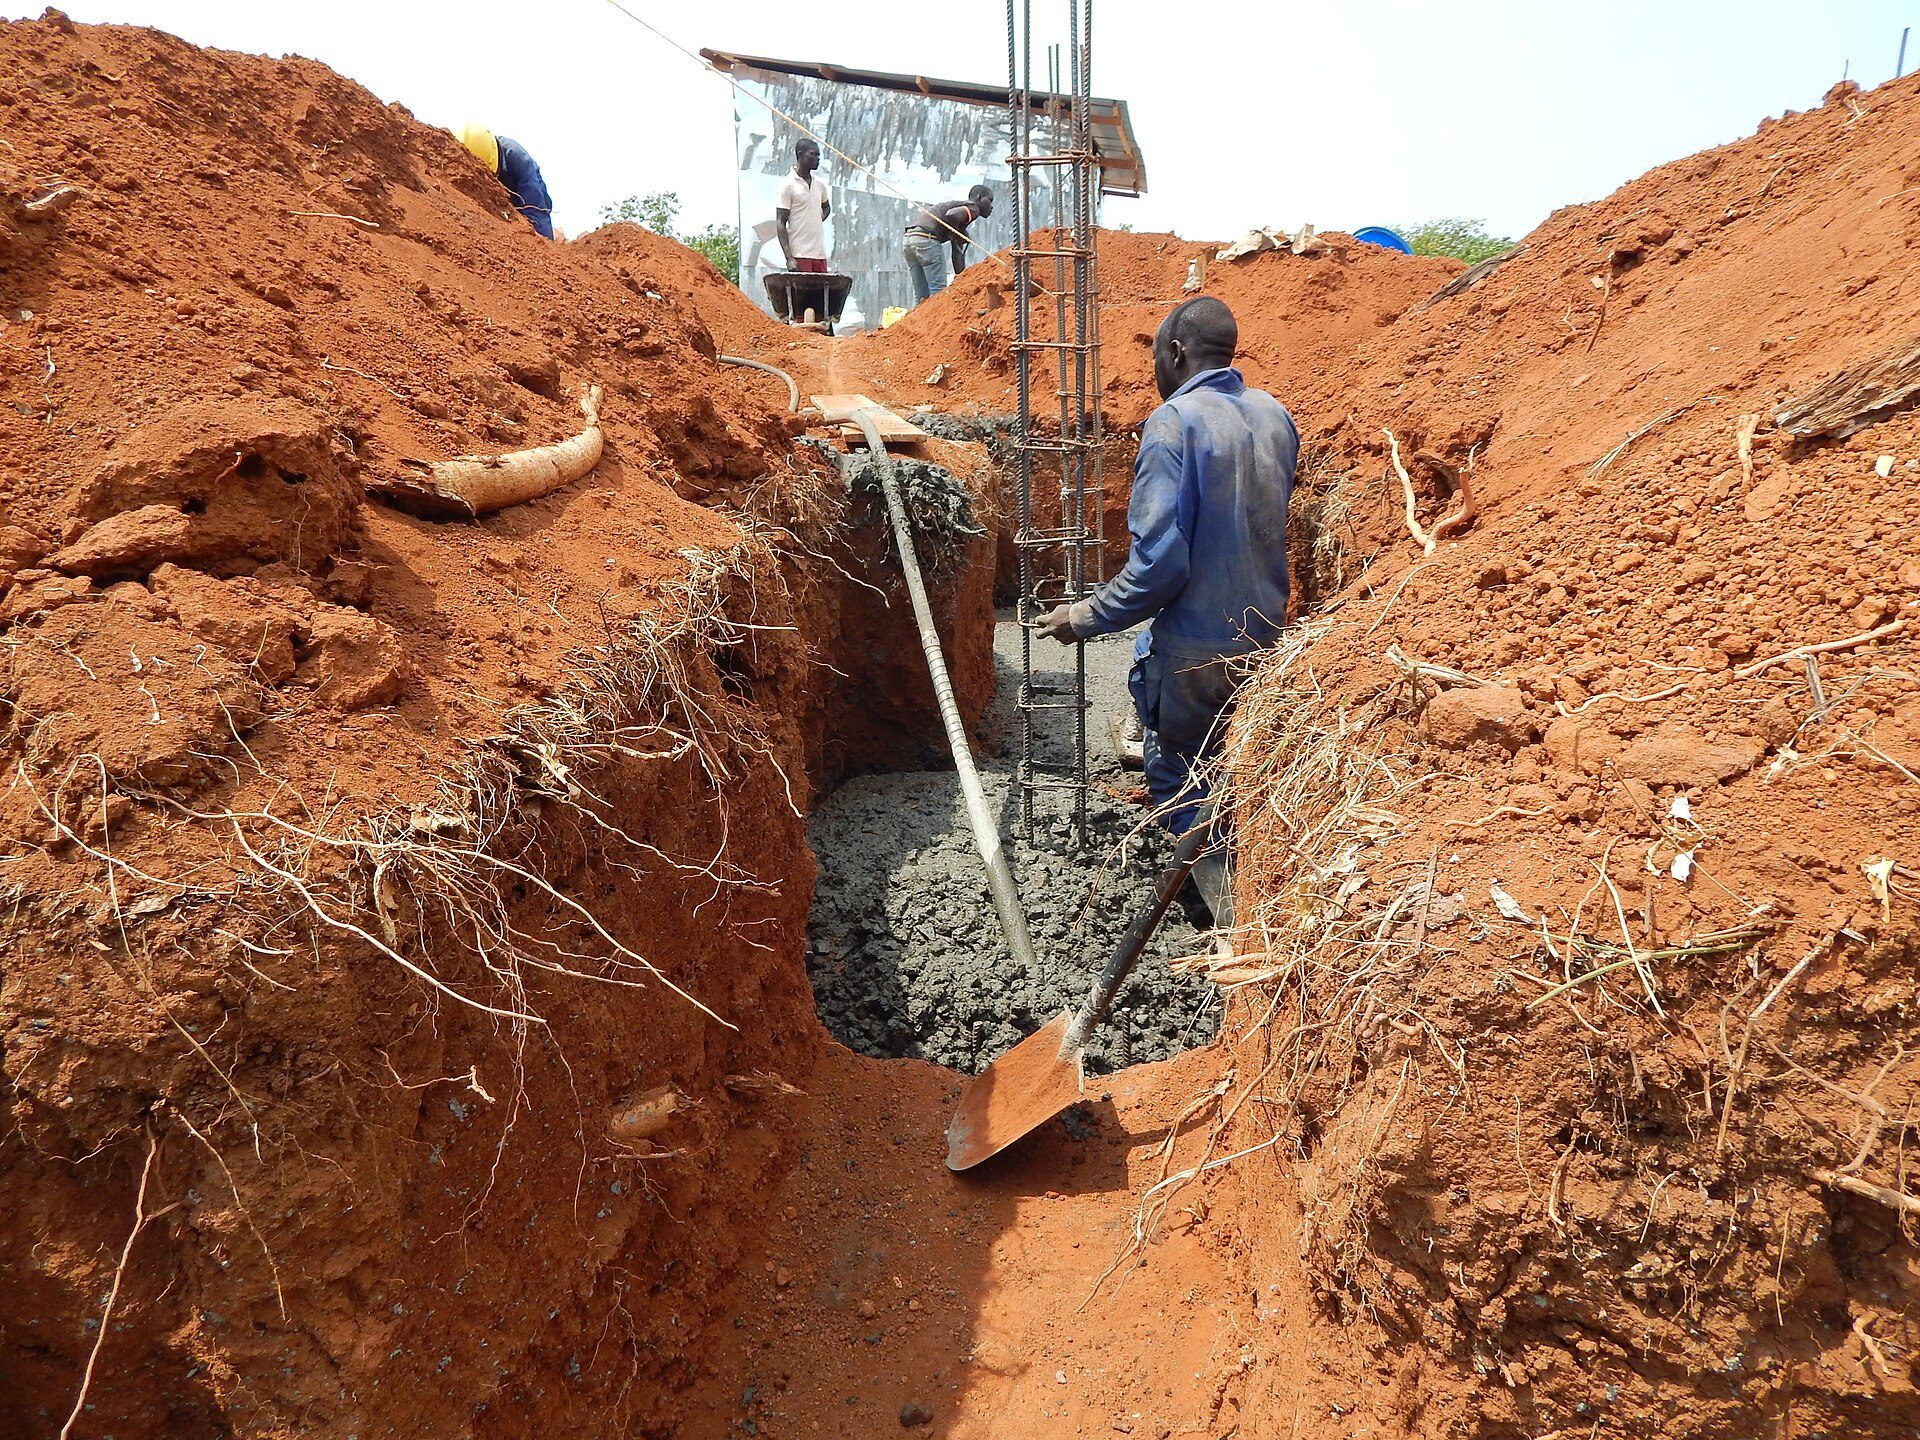
Concrete being placed in a reinforced strip foundation. Photo: Manu4ster, CC BY-SA 4.0, via Wikimedia Commons. Manu4ster, source, CC BY-SA 4.0
How it works: life-cycle stages (modules)
In Europe and the UK, building-level assessments follow EN 15978 (Sustainability of construction works – Assessment of environmental performance of buildings), and product data comes from Environmental Product Declarations (EPDs) made to EN 15804+A2. Both divide a building’s life into the same modules:
- A1-A3 (product stage): raw material supply, transport to the factory and manufacturing. Often called “cradle to gate”.
- A4-A5 (construction stage): transport to site and site works, including waste.
- B1-B5 (use stage, materials): maintenance, repair and replacement over the building’s life. (B6-B7 cover operational energy and water.)
- C1-C4 (end of life): demolition, transport, waste processing and disposal.
- D (beyond the system boundary): potential benefits from reuse, recycling or energy recovery, reported separately.
In the UK, the RICS professional standard Whole life carbon assessment for the built environment (2nd edition, published September 2023 and effective from 1 July 2024) sets out how to apply EN 15978 in practice. If a comparison says “cradle to gate”, it covers A1-A3 only; “cradle to grave” adds A4-C4. The two cannot be compared with each other.
The four checks for any material comparison
| Check | What to look for | Why it matters |
|---|---|---|
| 1. Life-cycle scope | Modules stated (A1-A3, A1-A5, A-C, with D separate) | Cradle-to-gate and cradle-to-grave figures are not comparable |
| 2. Functional unit | Per m² of element or building, with span, load, U-value or fire rating stated | Per-kg comparisons ignore how much material each option needs |
| 3. Data source | Product-specific verified EPD, industry-average EPD or generic database (with version and date) | Data quality and regional energy mix change results |
| 4. Biogenic carbon | Whether stored carbon is shown separately and whether module C is included | A negative timber figure can reverse once end of life is counted |
| (Extra) Reference period | Study period, e.g. 60 years in many UK assessments, and replacement cycles | Short-lived finishes add up over the building's life |
Source: Arch2O checklist based on EN 15978, EN 15804+A2 and the RICS WLCA 2nd edition (as of 2026-11-01).
If a comparison fails any of these checks, ask for the missing information before using it to make a decision.
Worked example: per kilogram versus per square metre
The most common error is comparing materials per kilogram. Materials with a low carbon factor per kilogram may still need far more mass to do the same job, and the reverse. The example below uses round, illustrative numbers chosen only to show the method; they are not values from any database or EPD. Use real EPD or database values for a real project.
Suppose two floor options span the same grid and carry the same load:
- Option A needs 400 kg of material per square metre of floor, with an illustrative factor of 0.15 kgCO2e per kg (A1-A3). Embodied carbon: 400 × 0.15 = 60 kgCO2e/m².
- Option B needs 100 kg per square metre, with an illustrative factor of 0.45 kgCO2e per kg (A1-A3). Embodied carbon: 100 × 0.45 = 45 kgCO2e/m².
- Per kilogram, Option A looks three times better (0.15 against 0.45). Per square metre of floor, which is what the building actually needs, Option B is 25% lower (45 against 60).
- Now add the consequences of mass: a heavier floor may need larger columns and foundations. If those add, say, 10 kgCO2e/m² for Option A, the gap widens to 70 against 45.
The lesson is to compare per functional unit: a square metre of floor meeting a given span and load, a square metre of wall with a given U-value and fire rating, or the whole building per square metre of gross internal area over a stated period (often 60 years in UK assessments).
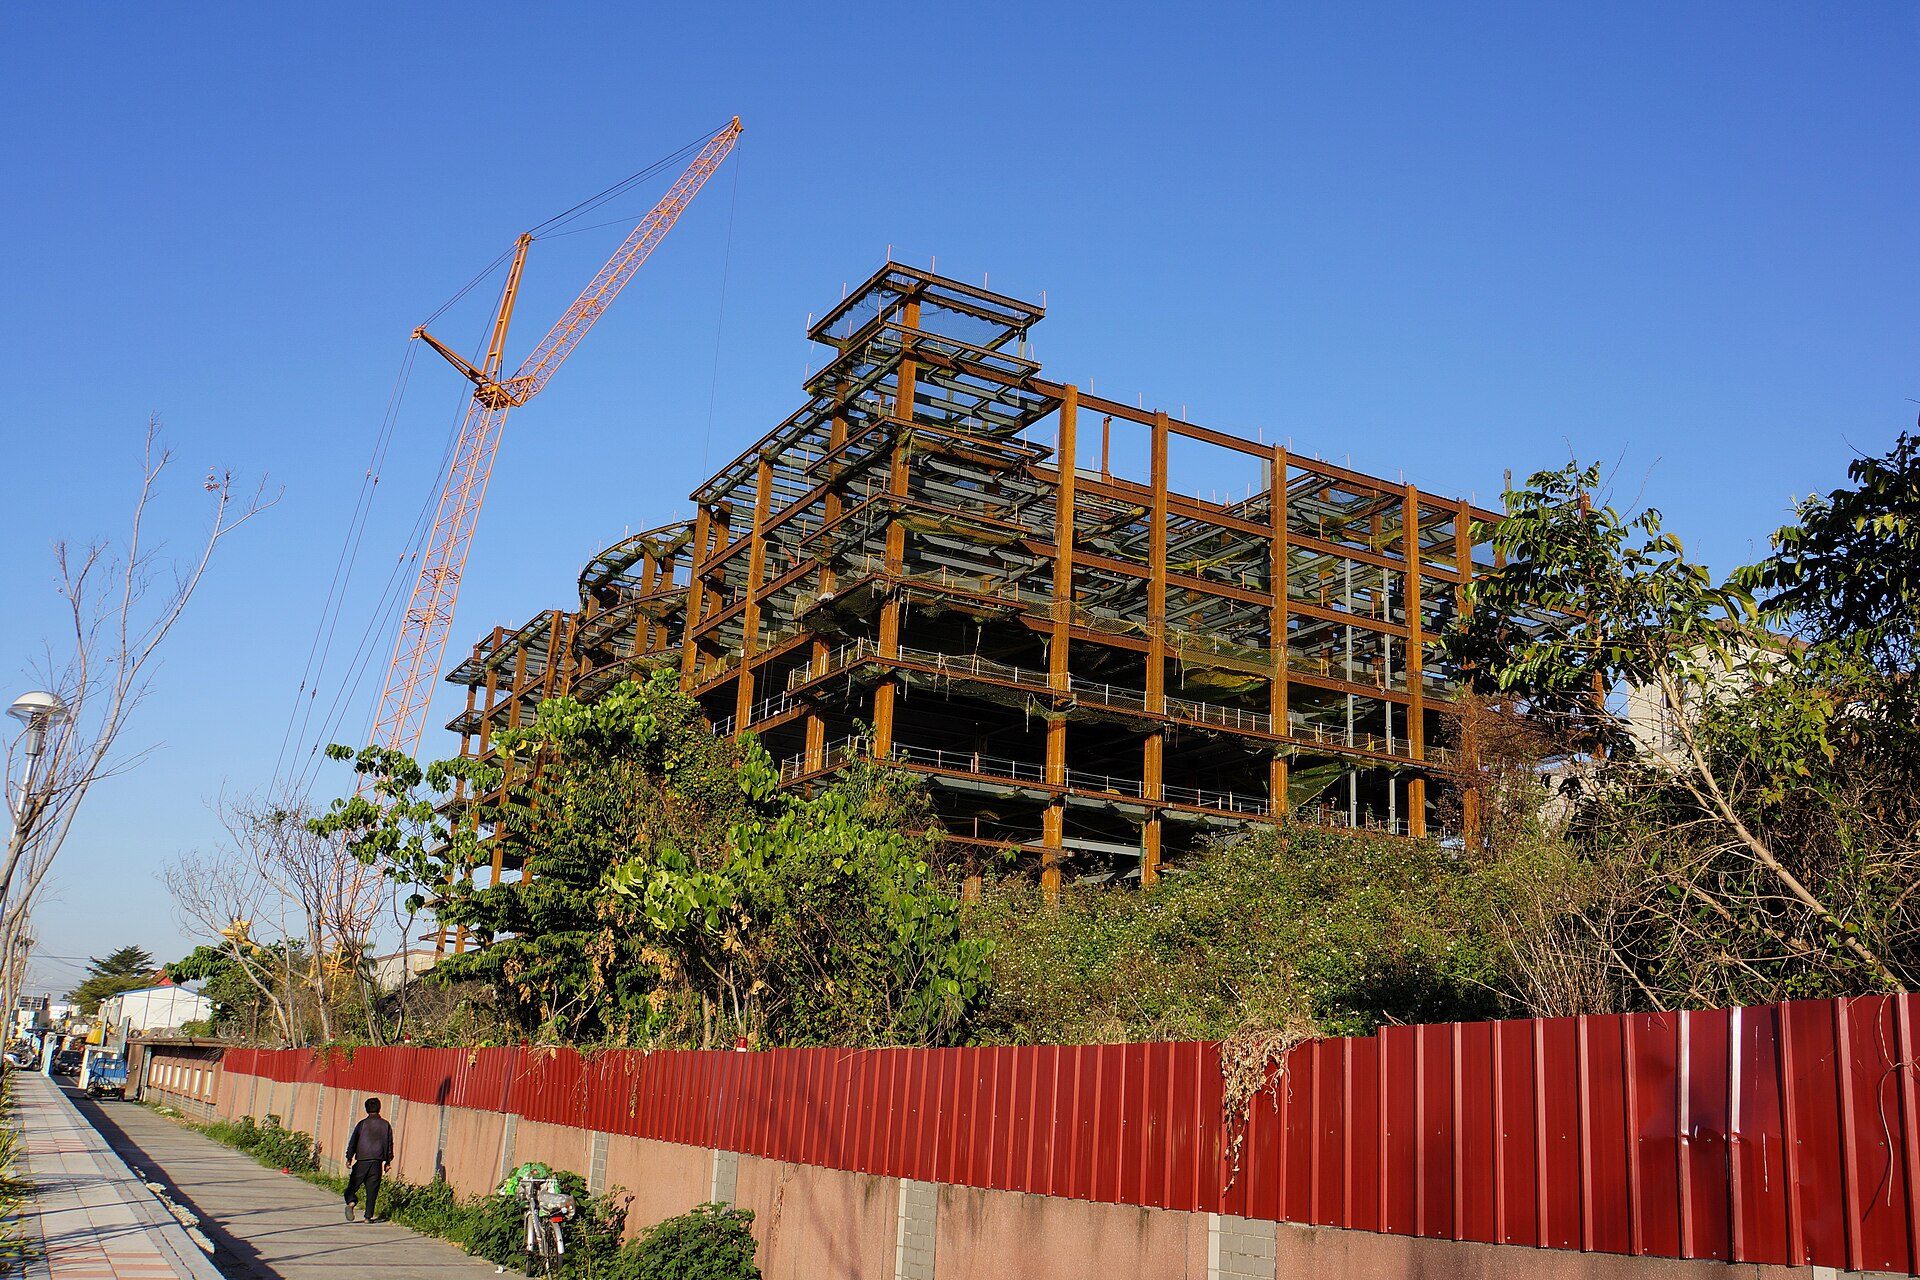
Steel frame of a multi-storey building under construction in Changhua, Taiwan. Photo: lienyuan lee, CC BY 3.0, via Wikimedia Commons. lienyuan lee, source, CC BY 3.0
Where the numbers come from
- Product-specific EPDs (EN 15804+A2 in Europe; ISO 14025 and ISO 21930 elsewhere) describe one manufacturer’s product from one plant or region. They are the best evidence at specification stage, if third-party verified and in date.
- Industry-average EPDs describe a sector average. Useful early in design, but they hide the spread between good and poor producers.
- Generic databases such as the Inventory of Carbon and Energy (ICE) database from Circular Ecology (version 4.0 released December 2024, later updated to 4.1) give typical values for early-stage estimates. Check the version, because values change between editions.
Geography matters as much as the material: the same product made with a coal-heavy grid or a cleaner grid can have very different A1-A3 figures, and long transport adds to A4.
Timber and biogenic carbon
Timber stores carbon absorbed by trees as they grow (biogenic carbon). Comparisons handle this in different ways. Under EN 15804+A2, the stored carbon is counted as a removal in A1-A3 and then released again at end of life (module C), so a “cradle to gate” timber figure can be negative while the full-life figure is not. The ICE database gives timber two coefficients, which must be added to get the total where the wood cannot be treated as carbon-neutral, for example when it is not from sustainably managed forests. Whenever a comparison shows a negative figure for timber, check whether module C is included and how the stored carbon has been reported.
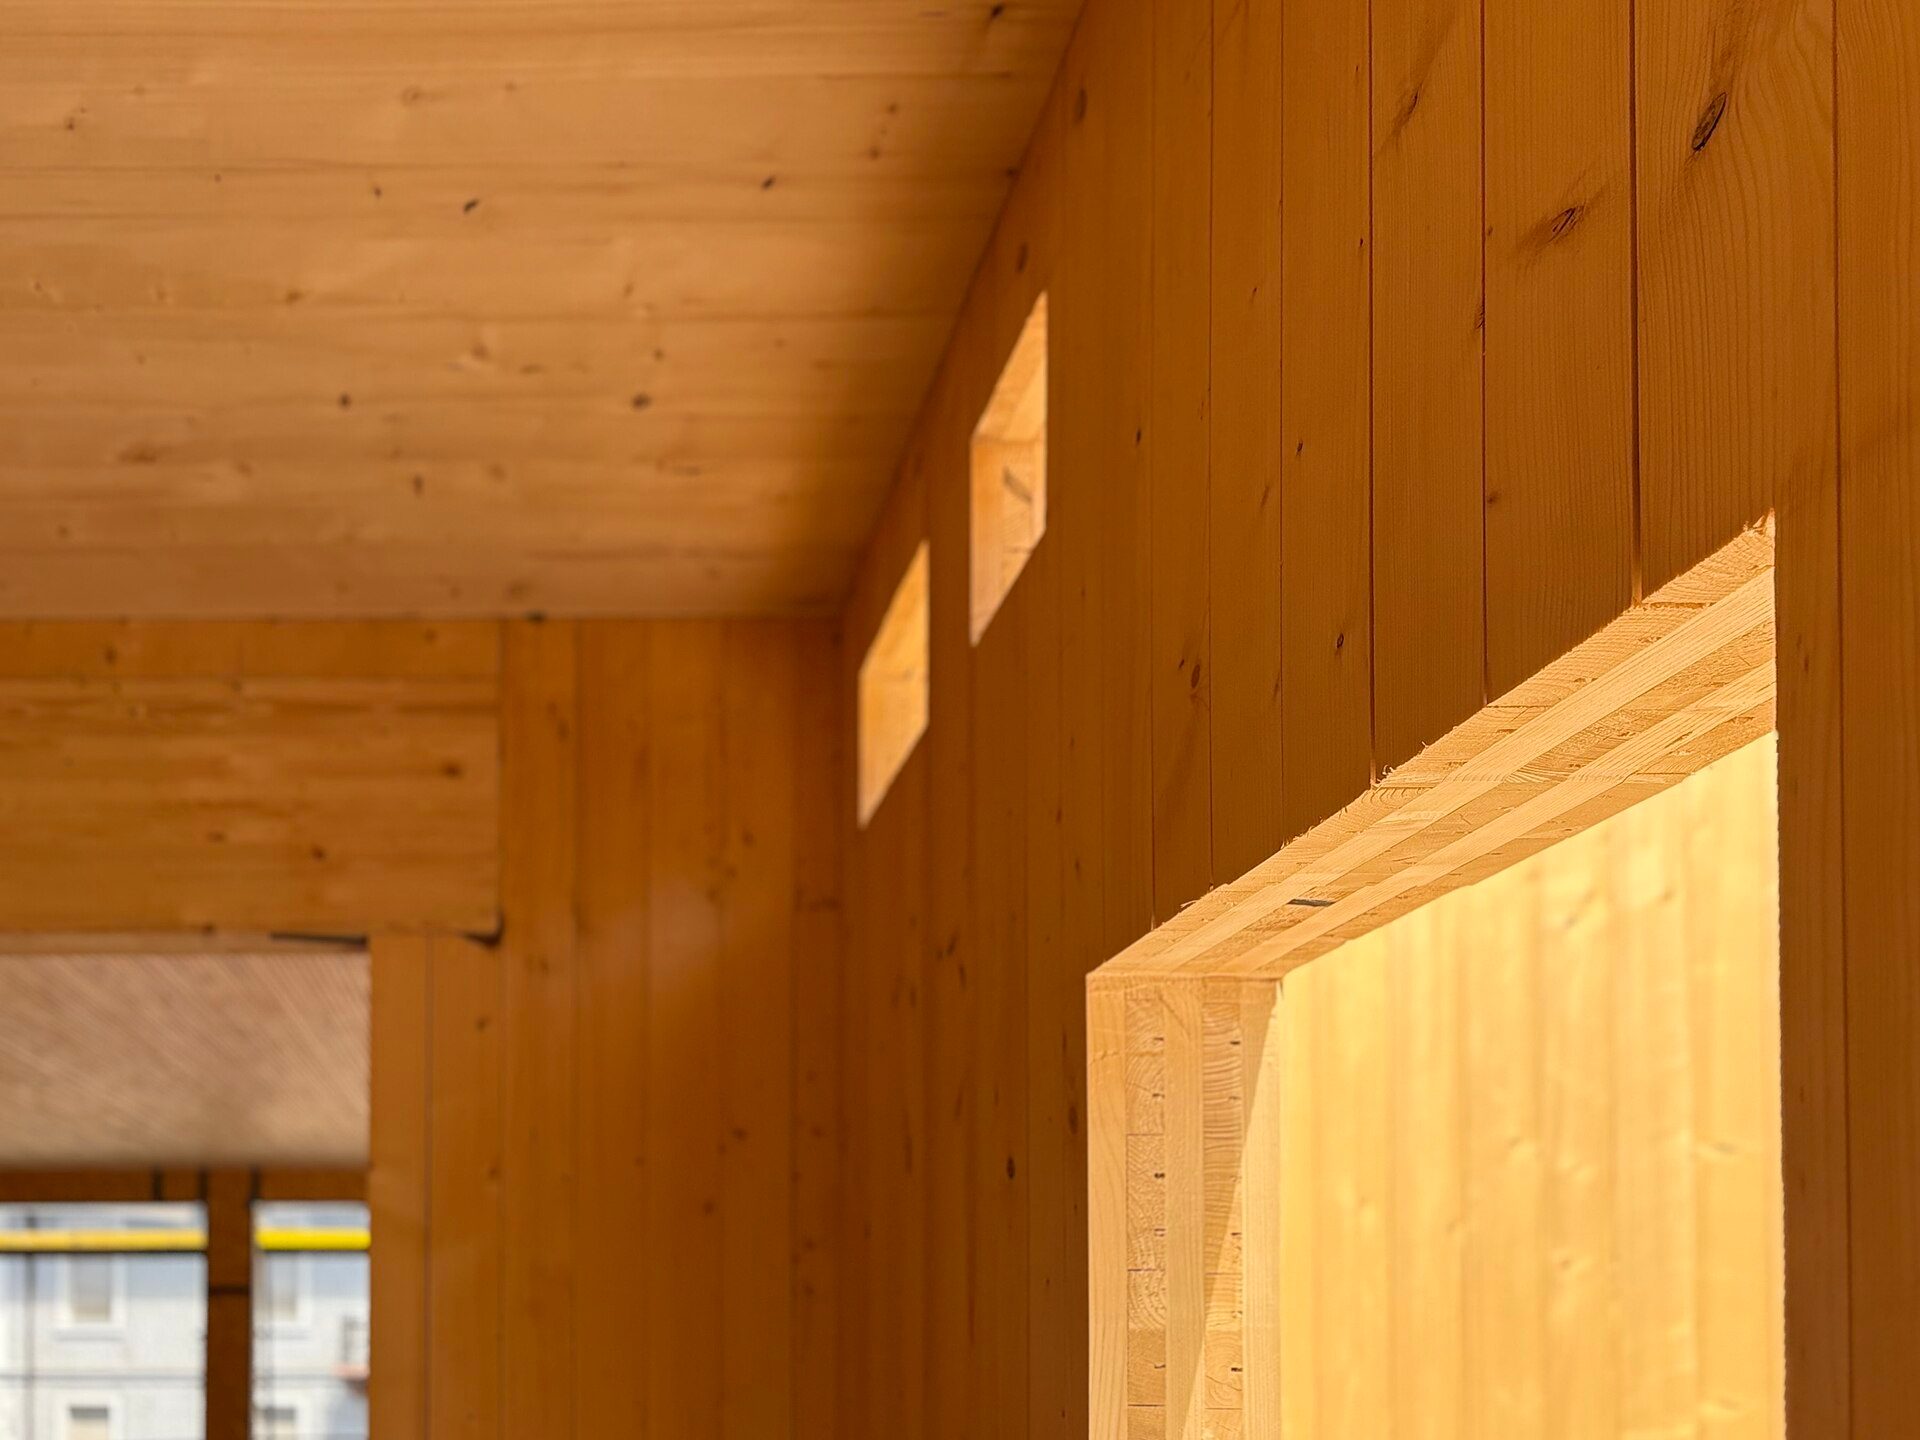
Interior of a building built from cross-laminated timber (CLT) panels. Photo: RoterRolf, CC0, via Wikimedia Commons. Image: RoterRolf (Creative Commons Zero)
Applicability: which comparisons suit which decisions
- Concept stage, any climate or building type: generic database values per functional unit are enough to rank structural systems and spot carbon hotspots, usually the frame, foundations and facade.
- Planning stage: some authorities, such as the Greater London Authority, ask for whole-life carbon assessments for large schemes; follow their template and module scope.
- Specification and procurement: use product-specific, verified EPDs, and write the carbon limit into the specification.
- Refurbishment versus new build: compare whole-life figures over the same period; retaining an existing structure avoids much of A1-A5, which is often the deciding factor.
Limitations and common misconceptions
- “Low-carbon material” is not a fixed label. The result depends on quantity, design, source and life-cycle scope.
- Module D is not a discount. Recycling benefits are reported separately because they depend on what happens decades from now.
- Precision is often overstated. Early-stage assessments carry wide uncertainty; a 5% difference between options is usually within the margin of error.
- Carbon is not the only criterion. Fire performance, durability, acoustics and cost still apply; a comparison should not override a safety requirement.
- Offsetting is not reduction. Building less, reusing more and choosing lower-carbon products come before offsets.
Decision summary
Before you accept an embodied carbon comparison, confirm the modules, the functional unit, the data source and the treatment of biogenic carbon. Compare options per square metre of the element or building, never per kilogram of material. For a wider view of how embodied carbon fits into design decisions, see Arch2O’s guide to what is sustainable architecture.

Emily Reyes is a Brooklyn-based architecture writer and Article Curator at Arch2O, known for her sharp eye for experimental design and critical theory. A graduate of the Southern California Institute of Architecture (SCI-Arc), Emily’s early work explored speculative urbanism and the boundaries between digital form and physical space. After a few years in Los Angeles working with boutique studios on concept-driven installations, she pivoted toward editorial work, drawn by the need to contextualize and critique the fast-evolving architectural discourse. At Arch2O, she curates articles that dissect emerging technologies, post-anthropocentric design, and contemporary spatial politics. Emily also lectures occasionally and contributes essays to independent design journals across North America.